XRP Tests 2026 Low Near $1 as Selling Pressure Persists Across Spot and Derivatives Markets
Key Takeaways
- •XRP is testing its yearly low near $1, with the next visible support zone located around $0.93 if this level fails to hold.
- •CoinGlass data shows negative XRP spot flows across every measured time window, with the seven-day net outflow reaching $47.19 million.
- •Derivatives markets recorded substantially larger outflows than spot, with seven-day futures net flow at negative $261.97 million, indicating deleveraging rather than new short selling dominates the derivatives-driven decline.
- •On August 11 at 03:00 UTC, approximately $2.11 million in long liquidations occurred against only $56,850 in short liquidations, confirming a long flush as XRP pressed into support.
- •Despite the spike in long liquidations, the funding rate remained positive at 0.0045%, suggesting some long bias persists and additional leveraged positions may remain vulnerable if the price continues lower.
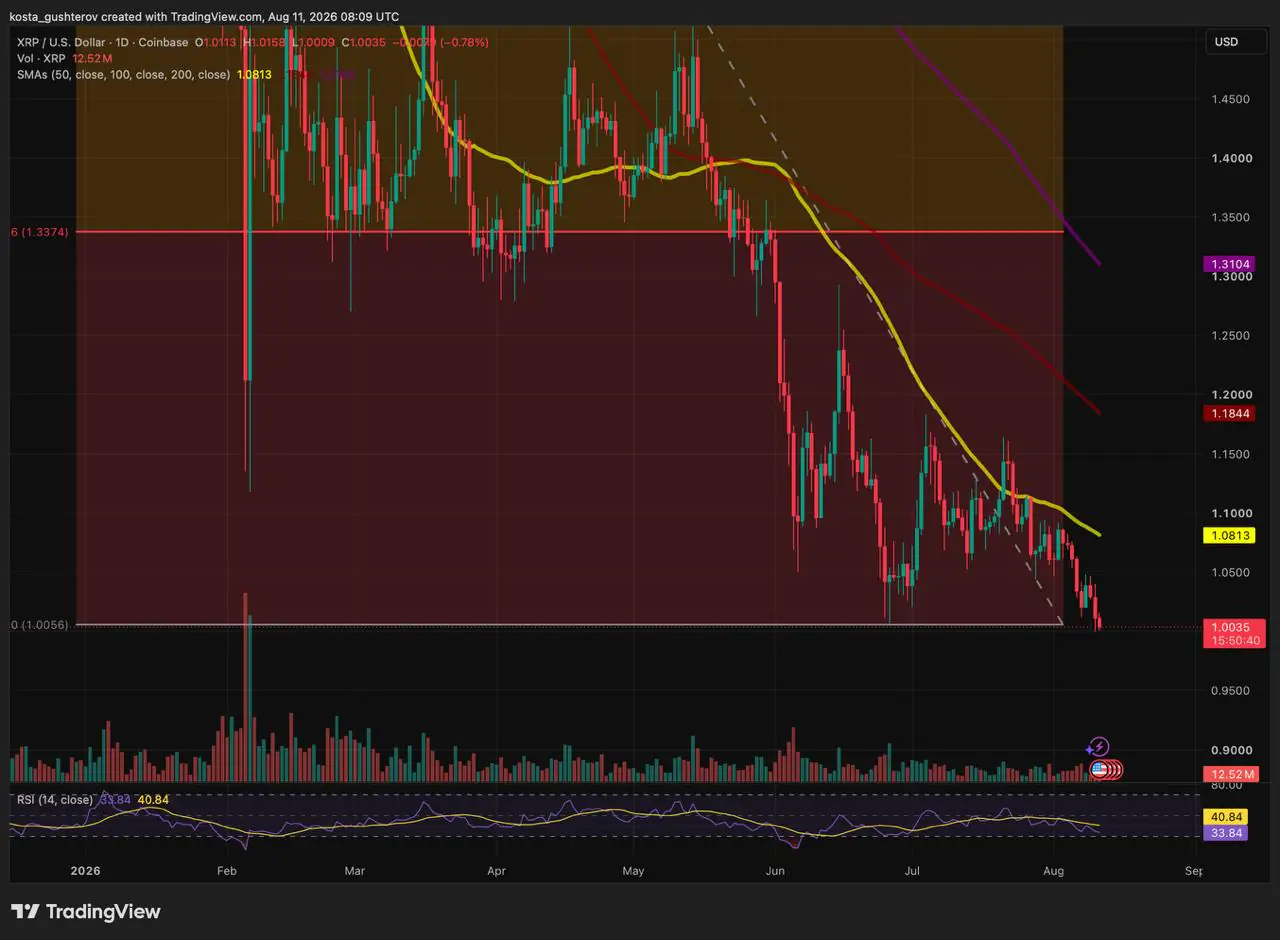
The coming sessions will determine whether XRP buyers can hold the year's lowest level or whether the ongoing decline is entering another downward leg. Both spot and derivatives market data indicate that sellers retain the upper hand, while the technical chart leaves bulls with considerable ground to recover.
XRP Pressured at Its 2026 Floor
The June low near $1.01 had stood as XRP's weakest point of the year until this week's price action briefly pushed below it. A momentary wick beneath $1 would not be decisive on its own. A sustained move under that level would carry significantly more weight, with the next visible support zone located around $0.93. The $1 threshold also functions as a widely watched psychological level for market participants, meaning that a confirmed break could attract additional attention from both spot traders and leverage-driven strategies that key off round-number milestones.
The daily Relative Strength Index (RSI) has declined to 33.9 but has not yet crossed below the 30 threshold. While XRP is approaching oversold territory, the indicator still permits additional selling pressure before reaching that technical extreme.
Technical Damage Extends Above
The deterioration is also evident higher on the chart. XRP has broken below the rising trend line that underpinned the June–July recovery and continues to trade beneath the 50-day Simple Moving Average (SMA), currently situated around $1.081. The moving average itself has begun to curve downward.
Maintaining the current low would halt the immediate decline from extending further, but it would not by itself repair the broader technical picture. A reclaim of the 50-day SMA would provide a more meaningful signal that buyers are recovering some of the ground lost during the selloff.
Order-flow data helps explain why that recovery has proven elusive: active selling remains dominant in both spot and derivatives markets.
Spot Flows Favor Sellers
CoinGlass data shows negative XRP spot flow across every measured time window in the snapshot.
Over the 24-hour period, inflows totaled $66.65 million against $76.17 million in outflows, producing a net flow of -$9.52 million. The negative imbalance widens to -$19.96 million over three days, -$32.26 million over five days, and -$47.19 million over seven days.
XRP is therefore testing major support without any clear pickup in aggressive spot buying demand. The widening of negative net flow over longer windows indicates that the selling pressure is not limited to a single-day event but has been building progressively, leaving little evidence of a sustained absorption effort from buyers at these levels. The imbalance in derivatives markets is considerably larger.
Long Liquidations Compound the Decline
XRP futures recorded a net flow of -$78.63 million over 24 hours, expanding to -$98.94 million over three days, -$163.03 million over five days, and -$261.97 million over seven days.
At 03:00 UTC on August 11, with XRP trading near $1.0039, CoinGlass recorded approximately $2.11 million in long liquidations against only $56,850 in short liquidations.
This skew confirms that a long flush was underway as XRP pressed into support. While it does not account for the full multi-day futures imbalance, forced position exits are clearly contributing to the selloff rather than the decline stemming solely from traders opening new short positions. The seven-day futures outflow figure, which dwarfs the corresponding spot imbalance, underscores the degree to which deleveraging rather than fresh short selling has dominated the derivatives-driven portion of this move.
Should $1 give way while that deleveraging process continues, forced selling could accelerate the breakdown.
Funding Rate Has Not Fully Reset
Despite the spike in long liquidations, XRP's open-interest-weighted funding rate remained positive at 0.0045% in the same snapshot. This indicates that some long bias persisted in the perpetual futures market even after leveraged buyers had already incurred losses.
Funding rates can shift rapidly during sharp price moves, so a single reading should not be over-interpreted. However, if the rate remains positive during a further move lower, there may still be vulnerable long exposure awaiting liquidation.
A cooler funding rate, combined with buyers holding the current support, would offer a healthier signal that excess leverage has been cleared without precipitating another leg downward.
$1 Marks the Dividing Line
XRP now sits at the juncture where the decline either stabilizes or begins to undermine the year's broader price structure.
A confirmed break below $1 would eliminate the support that arrested the June selloff. That risk is compounded by negative spot flows, heavier futures selling, and a liquidation skew that has already penalized leveraged long positions.
A successful defense would preserve the yearly low, but buyers would still need to recover the technical ground surrendered during the decline before the chart structure begins to improve. Beyond the price level itself, the metrics most worth monitoring in the coming sessions are whether the spot net flow turns positive, whether the funding rate cools into negative territory indicating a leverage reset, and whether the RSI breaches 30 — each of which would signal a different phase of the current selloff.
For now, the burden rests squarely on buyers. Holding $1 keeps the recovery scenario intact; losing it would hand control back to sellers.
Disclaimer: This article is for informational purposes only and does not constitute financial or investment advice. Cryptocurrency markets are highly volatile, and readers should conduct their own research before making any investment decisions.

