XRP Tests $1 as Descending Triangle Pressure Builds
Key Takeaways
- •XRP traded near $1.0022 on August 15, with the session staying tightly clustered around the dollar level.
- •The chart shows a descending triangle, with resistance from the July highs now approaching the $1.10 to $1.15 area.
- •The daily RSI is near 36, indicating that momentum remains below neutral and has not reached oversold conditions.
- •A sustained close above $1 would support a stronger short-term structure, while a daily close below $1 would strengthen the bearish case.
- •If buyers break the descending resistance, the next levels to watch are around $1.20 and then $1.30 to $1.40.
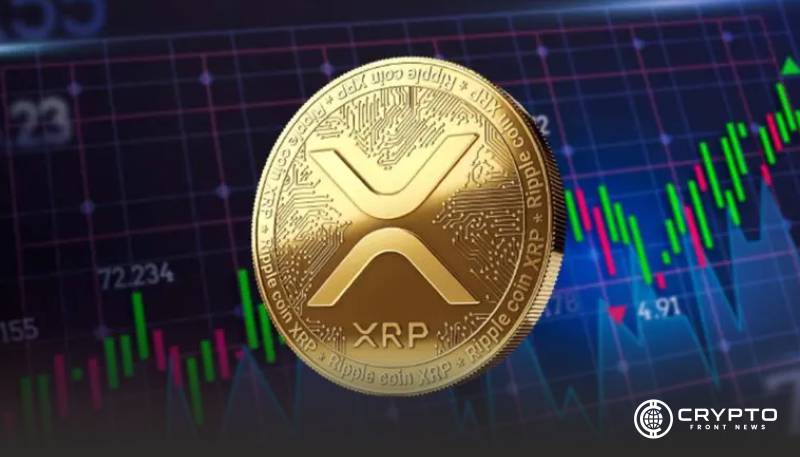
XRP is testing $1 as buyers defend the level and sellers push for a decisive daily breakdown beneath the psychological boundary. A break above $1.10 could challenge descending resistance, while weakness in the daily RSI preserves downside pressure across trading conditions. A widely noted $0.9999 reading adds psychological focus, but sustained acceptance above $1 remains the condition for a stronger bullish market structure.
XRP sits near a key psychological threshold as the descending triangle continues. The formation pairs a flat base with a steadily lowering resistance line, a shape classical chart analysis reads as building pressure against support, though such patterns are only considered resolved after a confirmed close beyond one of the boundaries. Weak momentum keeps traders focused on confirmation before the market establishes direction near $1.
$1 Support Becomes the Main Market Test
XRP traded near $1.0022 on August 15, keeping the psychological level in focus. As one of the most actively traded digital assets, XRP draws broad market attention whenever price clusters at a widely recognized level. The daily chart shows repeated reactions around this area since early June, leaving price positioned at a clear decision point for buyers and sellers.
XRP Update recently referenced a $0.9999 reading near the same threshold. The post linked the repeated digits with an ending cycle and a possible new beginning. From the chart, however, sustained price acceptance remains the measurable factor.
The August 15 session opened around $0.9993, reached approximately $1.0076, and recorded a low near $0.9981, showing limited movement around the dollar level. Such tight trading reflects a market waiting for stronger directional participation.
XRP has also shown difficulty maintaining sustained closes above $1. That behavior keeps the threshold relevant as both resistance and potential support. A sustained hold above it would provide stronger evidence of an improving short-term structure.
Descending Triangle Keeps Pressure on XRP
The daily structure contains a descending resistance line drawn from the July highs. That line currently approaches the $1.10–$1.15 region, and buyers need to overcome this declining barrier before the structure changes materially.
The horizontal base remains near $1, creating the triangle's lower boundary. Multiple support tests have occurred without producing a sustained recovery, and repeated tests can increase downside pressure when buyers cannot generate stronger rebounds. In standard pattern study, descending triangles are generally categorized as bearish continuation formations, although the label only carries weight once price closes outside the pattern with confirming activity.
A confirmed break above the descending line would shift attention toward higher resistance zones. The next area to watch is around $1.20, followed by the $1.30–$1.40 region. Confirmation would require a daily close and stronger trading activity.
A daily close below $1 would instead strengthen the bearish setup. Historical chart structure places possible downside areas near $0.90 and $0.80. Those levels would depend on momentum following any confirmed support failure.
RSI Shows Momentum Has Not Recovered
The daily RSI currently stands near 36, while its moving average sits around 39. The Relative Strength Index measures the pace of recent price changes on a 0–100 scale, with readings below 30 conventionally treated as oversold and readings above 70 as overbought. That positioning shows momentum remains below its recent neutral range. The indicator, however, has not reached deeply oversold territory.
RSI weakness leaves room for additional selling if $1 fails decisively. Conversely, a recovery above 40 could signal improving momentum conditions. A move toward 50 would provide stronger confirmation of renewed buying pressure.
Trading volume remains comparatively subdued across the recent consolidation. Earlier heavy activity accompanied sharper price movements during previous declines. Current conditions instead suggest limited conviction while XRP remains near the triangle base.
The market therefore remains balanced around a closely watched technical boundary. The $0.9999 reference adds psychological attention, but price action must confirm any cycle change. Until then, $1 remains the clearest dividing line between recovery and renewed weakness.

