XRP Price Puts $2 Breakout in Focus as W-Pattern Maps $13 Macro Target
Key Takeaways
- •XRP traded near $1.41 on Sept. 21, with CoinGecko data showing a 24-hour range between $1.37 and $1.44.
- •The token is compressed between its 20-week EMA near $1.29 and its 50-week EMA near $1.52, a range typically read as a market that has not yet chosen direction.
- •EGRAG's Macro W10 pattern sets targets of $13, $22, and $35, all contingent on a full-body monthly close above the handle followed by a breakout, retest, and hold above $2.
- •Analyst ChartNerd identified a liquidity area near $1.80 that matches the former 2025 support base, a level where price reactions are common on the way back up.
- •A second EGRAG Crypto chart structure lists potential macro levels at $5, $11.50, $25, $60, $135, $300, and $589, which require XRP to hold the 77 EMA, reclaim the 33 EMA, and break diamond resistance.
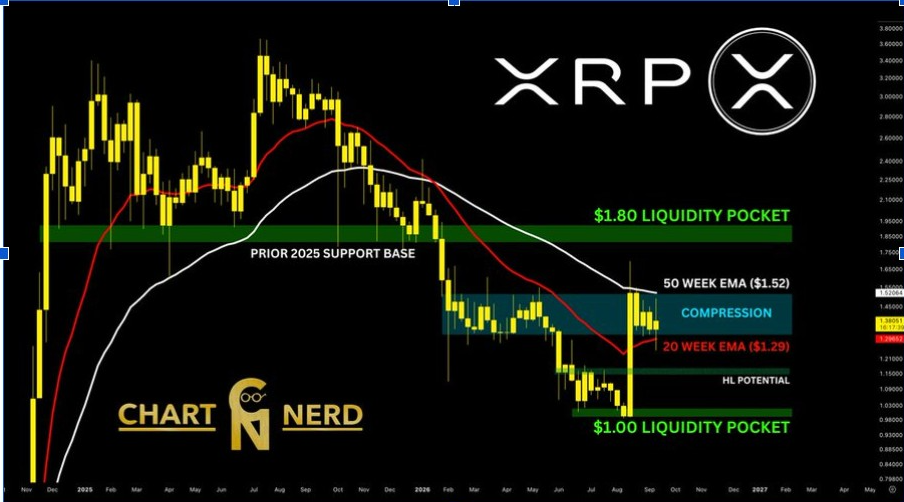
XRP price traded near $1.41 on Sept. 21, with traders watching a resistance band between $1.52 and $2 as a long-term W-pattern formation maps macro targets at $13, $22, and $35 in the event of a confirmed breakout above $2. Data from CoinGecko placed the token's 24-hour range between $1.37 and $1.44. In technical analysis, W-shaped formations are generally read as reversal structures whose targets only come into play after price clears the formation's resistance, which is why the $2 line anchors this particular setup.
The asset currently sits between its 20-week EMA and its 50-week EMA near $1.52, a positioning that reflects ongoing price compression. Long-term XRP charts circulated by analysts also mark $5, $11.50, $25, $60, $135, $300, and $589 as potential macro levels. These broader projections remain based on analyst chart structures rather than confirmed market targets.
$2 Becomes the First Test
XRP holds above its 20-week EMA near $1.29, while the 50-week EMA sits around $1.52, placing the token inside a compression zone between short-term support and higher resistance. Weekly EMAs weight recent closes more heavily and are widely used as trend references, so price caught between them is typically read as a market that has not yet chosen direction. Analyst ChartNerd has also identified a liquidity area near $1.80, a level that matches the former 2025 support base (X post). Liquidity zones like this mark areas where resting orders tend to accumulate, and a former support base that has been lost often acts as resistance on the way back up, a dynamic that makes $1.80 a level where reactions are common. A move through $1.52 and then $1.80 would put the $2 level back into direct focus.
EGRAG Crypto says the monthly structure needs a full-body close above the handle before the larger setup can progress (X post) — a reference to a candle that finishes near its high, which analysts treat as a sign that buyers held control through the entire period. The analyst then looks for a breakout above $2, followed by a retest and hold of that level — a sequence he said would strengthen the long-term W-pattern setup. XRP still trades below that threshold, meaning the setup has yet to complete those steps.
The current structure therefore centers on whether buyers can keep price above weekly support while pushing through nearby resistance.
W-Pattern Maps $13 as Macro Target
EGRAG Crypto continues to track what he calls the "Macro W10" pattern, a long-term W formation that spans several market cycles (X post). Under that framework, the analyst sets $13 as the conservative target, $22 as the average target, and $35 as the optimistic target. All three sit well above the current XRP price and depend on a confirmed breakout from the handle. Tiered targets of this kind are a common way chartists frame scenarios of increasing difficulty, with each level requiring a progressively stronger breakout.
The analyst also shared a separate view from Sir Robert, who maps a possible 650% move toward roughly $7.50. EGRAG Crypto treats that figure as a distinct trading target rather than a replacement for the W-pattern projections.
Price Holds Between $1.00 and $1.80 Zones
On the weekly chart, an important liquidity pocket sits near $1.00, with a higher liquidity area near $1.80. Order clusters in zones like these are why traders watch them for reactions, since price movement can quicken once it reaches them. The token currently trades between those zones, while the 20-week EMA near $1.29 serves as the lower moving-average reference and the 50-week EMA near $1.52 forms the next technical barrier above the current price.
A sustained move below $1.29 would weaken the short-term recovery structure and shift attention back toward the $1.00 region. Conversely, a move above $1.52 would bring $1.80 and then $2 into focus. XRP has not yet cleared either of those upper levels, keeping the market inside a defined range while traders wait for confirmation from weekly and monthly closes.
A second EGRAG Crypto setup places XRP inside a broad ascending structure and tracks a diamond formation on the macro chart. That model lists potential levels at $5, $11.50, $25, $60, $135, $300, and $589. Before any of those levels come into play, the analyst says XRP must hold the 77 EMA, reclaim the 33 EMA, and break diamond resistance. With the current price near $1.41, several barriers remain between XRP and the higher macro levels; for the nearer setup, $1.52, $1.80, and $2 stand as the immediate checkpoints.
This article is for informational purposes only and does not constitute financial or investment advice. Cryptocurrency investments involve risk, and past performance does not guarantee future results. Readers should conduct their own research before making investment decisions.
Source: The Market Periodical

