XRP Price Holds $1.47 as Descending Triangle Pressure Builds: Key Supports Below
Key Takeaways
- •XRP traded near $1.467 on Binance, down roughly 1.5%, as it pressed the $1.46-$1.47 lower boundary of a descending triangle that formed after its rally toward the $1.55-$1.57 area.
- •Only a daily close below $1.46-$1.47 would confirm a support break, since an intraday wick beneath the floor can reflect a failed seller attempt rather than a breakdown.
- •If the current floor fails, the first lower support sits at $1.426-$1.43 at the 0.382 Fibonacci retracement, followed by a stronger zone at $1.34-$1.35 that combines the 0.5 retracement near $13427 with a former descending channel boundary.
- •A rebound through the descending resistance near $1.49-$1.50 would signal buyers breaking the lower-high sequence, with horizontal resistance at the 0.236 Fibonacci level near $1.53 as the next target.
- •Descending triangles often lean bearish because repeated tests can weaken demand at the floor, but the formation counts as unresolved consolidation until price closes beyond one of its boundaries.
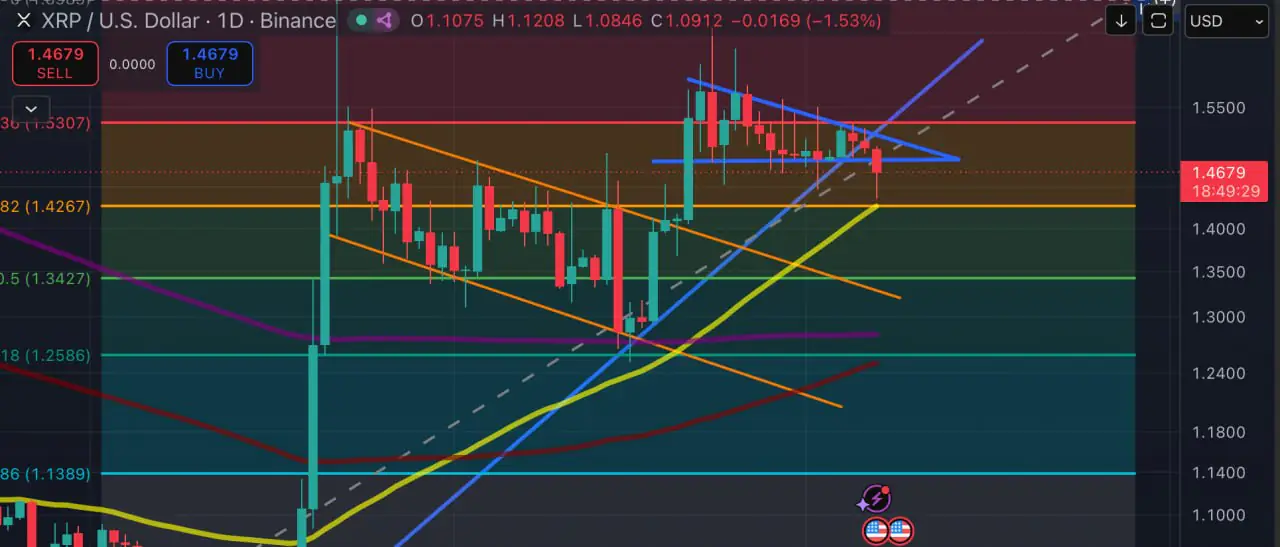
XRP is trading at a decisive juncture, with the token pressing against the lower boundary of a descending triangle pattern that has been forming since its rally toward the $1.55-$1.57 area.
Price Returns to Support Under Pressure
XRP changed hands near $1.467 on Binance's daily chart at the time of writing, down roughly 1.5% on the still-open candle. The decline has carried price back to the lower edge of the recent blue formation, a zone where buyers previously stepped in around $1.46-$1.47.
An intraday dip alone does not settle the test of this floor. A wick beneath support can reflect a failed attempt by sellers to force a breakdown, whereas a daily close below $1.46-$1.47 would show that XRP finished the session beneath the level that has contained recent pullbacks.
Lower Highs Shape a Bearish-Looking Structure
Since the move toward the $1.55-$1.57 area, XRP's rebounds have stalled at progressively lower points — a sequence of lower highs that chart readers treat as gradually eroding upward momentum. Buyers, meanwhile, have continued to defend a similar floor near $1.47. Together, these two lines form a descending triangle that draws increasing attention to the lower boundary.
Descending triangles often lean bearish because repeated tests can weaken demand at the floor. Even so, triangle patterns are generally treated as unresolved consolidation until price closes beyond one of their boundaries, so XRP must lose that area on a closing basis before the formation carries more weight than a short-term consolidation.
Support can still hold. A rebound that lifts XRP back through the descending upper line would show that the latest sell-off not taken control of the range.
$1.43 Comes Before the Deeper $1.35 Test
Even if XRP loses its current floor, the chart does not point directly to $1.35. The first lower area sits at $1.426-$1.43, where the 0.382 Fibonacci retracement — one of the standard ratios traders project from a prior advance to gauge how much of it has been given back — may attract a reaction. That zone has already played an important role in the correction: XRP's earlier channel breakout also left $1.40-$1.43 as the area buyers needed to protect during the first pullback.
The more consequential support zone lies around $1.34-$1.35. It combines the 0.5 Fibonacci retracement near $1.3427 with the projected upper boundary of the orange descending channel that XRP broke above during its September recovery. A former channel ceiling can act as support when price returns to it later, a role reversal that technical analysts refer to as polarity.
Unlike the horizontal Fibonacci levels, the former channel boundary shifts over time. Its overlap with the 0.5 retracement gives the $1.34-$1.35 area more weight than either reference could carry on its own.
Buyers Need More Than a Small Bounce
If $1.46-$1.47 holds, the immediate downside case loses force, though XRP would still need more than a brief rebound to improve the chart. Recovering the descending resistance near $1.49-$1.50 would show that buyers are breaking the recent sequence of lower highs.
The horizontal resistance at the 0.236 Fibonacci level near $1.53 comes next. A close above it would place XRP back over the range that produced the triangle and make the lower-high pattern far less convincing.
XRP now trades at the level that could determine whether the triangle remains a developing pattern or turns into a completed support break. A close beneath $1.46-$1.47 would shift attention toward $1.43 and then $1.35; a recovery through $1.49-$1.50 would show that buyers still have a route back into the range.
Chart source: TradingView, XRP/USD on Binance / October 7, 2026.
This article is for informational purposes only and does not constitute investment or trading advice. Technical levels are approximate and do not guarantee future price movements.

