XRP Whales Accumulate as Price Tests $1.16 Breakout Level
Key Takeaways
- •XRP remains below the $1.16 resistance level despite trading above its 50-day moving average.
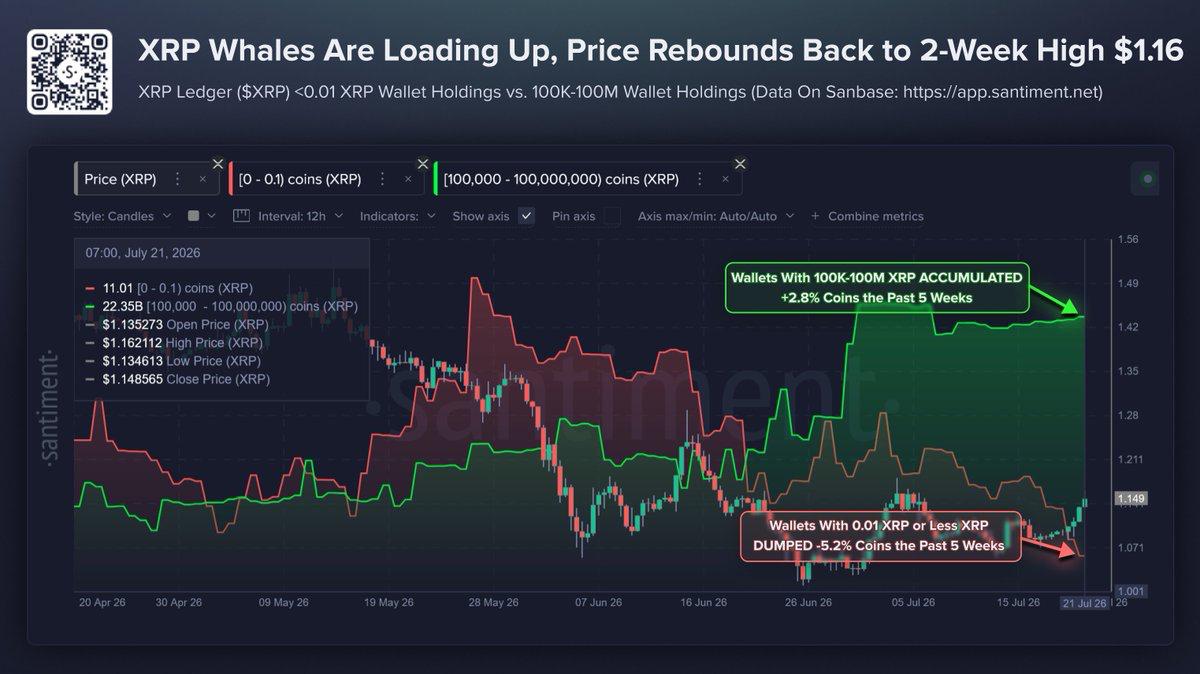
- •Wallets holding 100,000 to 100 million XRP increased their combined balances by 2.8% over five weeks, according to Santiment data.
- •Micro wallets holding less than 0.01 XRP reduced their balances by 5.2% during the same period.
- •A daily close above $1.16 with rising volume could point to a measured target near $1.30 to $1.32.
- •The broader trend has not reversed because the 50-day average remains below the falling 100-day average and the 200-day average is higher near $1.412.
XRP is trading above its 50-day moving average as price compresses between a horizontal resistance ceiling at $1.16 and a rising support line extending from the cycle low near $1.01. The resulting structure can be interpreted as an ascending triangle with inverse head-and-shoulders characteristics, though neither reading is confirmed while XRP remains below the neckline. XRP, the native asset of the XRP Ledger used for cross-border payments and decentralized finance applications, has been range-bound for weeks as the broader digital asset market weighs macroeconomic uncertainty against improving spot ETF sentiment for multiple cryptocurrencies.
The technical setup is unfolding alongside a notable divergence in wallet behavior. According to Santiment data, wallets holding between 100,000 and 100 million XRP increased their combined holdings by 2.8% over a five-week period. During the same stretch, micro wallets holding less than 0.01 XRP reduced their balances by 5.2%. On-chain wallet concentration is widely tracked as an indicator of how positioned large participants are relative to retail, and divergences between cohorts are often monitored as a gauge of conviction during consolidation phases.
Large Holders Accumulate Into the Recovery
The wallet distribution adds context to XRP's rebound. Larger holders have been increasing exposure while the smallest wallet cohort has moved in the opposite direction. This does not guarantee that resistance will break, but it indicates the recovery is taking place alongside accumulation from addresses with substantially larger positions.
That dynamic distinguishes the current test from a bounce driven solely by broad short-term participation. Large-wallet holdings have grown during the same period in which XRP formed higher lows above the late-June bottom, creating alignment between the on-chain trend and the developing price structure.
The micro-wallet reduction also warrants careful interpretation. A 5.2% decline among addresses holding less than 0.01 XRP reflects a behavioral shift within the smallest cohort rather than necessarily significant market-wide selling pressure. The more relevant signal is the contrast between the two groups: larger wallets are accumulating while the smallest wallets are reducing exposure.
The $1.16 Resistance Test
The immediate question is whether XRP can convert $1.16 from resistance into support. Price has approached that area while holding above the 50-day average, but it has not yet produced a confirmed daily breakout.
The structure has tightened as the rising trendline converges toward the horizontal ceiling. That compression narrows the space available for sideways movement and brings the market closer to a directional decision. When an ascending triangle compresses toward its apex, the range between support and resistance contracts, which typically increases the likelihood of a volatility expansion in one direction.
Momentum has improved without becoming stretched. The daily relative strength index (RSI) stands near 55 and has been forming higher lows, indicating that buying pressure has strengthened while remaining below overbought territory. This leaves room for continuation, though momentum alone cannot confirm the pattern. Price data reflects levels tracked on platforms including TradingView.
Upside Scenario
A daily close above $1.16, supported by increasing volume, would confirm that buyers have cleared the neckline and the upper boundary of the base. The measured move from the structure could then point toward the $1.30 to $1.32 region.
That path would not be without resistance. XRP's falling 100-day simple moving average sits near $1.254, making the area around $1.25 the first major supply zone above the breakout level. Price would need to reclaim that average before the broader recovery could extend toward the full measured target.
A breakout lacking stronger volume would carry less conviction. XRP has already tested the resistance zone multiple times, so confirmation requires more than a brief move above it. The daily close and the market's ability to hold the level would matter more than an intraday spike.
Rejection Scenario
Another rejection from $1.16 would keep XRP inside the base and refocus attention on the 50-day average near $1.12. That level currently provides the first layer of short-term support and separates the latest recovery attempt from another move toward the lower boundary of the pattern.
If the 50-day average fails, the rising support line around $1.07 to $1.08 becomes the more critical defense. That trendline connects the higher lows formed after the late-June bottom and defines the constructive side of the current setup.
A decisive loss of the rising support would invalidate the triangle structure and weaken the inverse head-and-shoulders interpretation. Under that scenario, $1.05 would resurface as the next visible support, followed by the cycle low near $1.01.
The Larger Trend Has Not Reversed
Although the short-term structure has improved, XRP is still building a countertrend base within a broader downtrend. The 50-day average remains below the falling 100-day average at $1.254, while the 200-day average sits considerably higher near $1.412.
That bearish alignment indicates the longer-term trend has not yet turned. Holding above the 50-day average represents an early improvement, but it is not equivalent to reclaiming the larger market structure. In technical analysis, a confirmed trend reversal typically requires shorter-term moving averages to cross above longer-term ones, a sequence XRP has not yet completed.
This article is provided for informational purposes only and does not constitute financial, investment, or legal advice.
