XRP Tests Multi-Layer Support Near $1.03 as Analysts Track Recovery Path Toward $1.65
Key Takeaways
- •XRP is consolidating near $1.13 at the confluence of multiple technical support structures, including a three-day trendline, a two-week Gaussian channel, and a long-term symmetrical triangle retest.
- •The 23.6% Fibonacci level at $1.0344 serves as the first key support, with the recent low recorded near $1.009.
- •Analysts identify $1.22, $1.33, and $1.65 as immediate recovery milestones, while broader measured-move projections extend to $6.40 and $30 if the macro structure holds.
- •The critical macro support region between $0.85 and $0.88 marks the convergence of the triangle boundary, the White Bridge trendline, and the monthly 111 EMA.
- •The three-day RSI stands at 43.23, above its signal line but below the neutral 50 threshold, indicating improving momentum without a confirmed trend reversal.
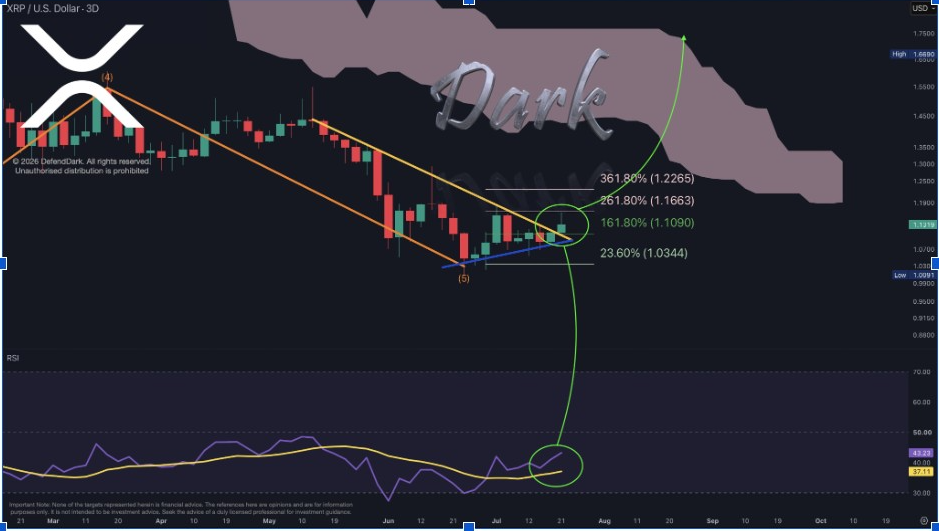
XRP is attempting to stabilize near $1.13 following an extended correction from its previous cycle high. Multiple technical analyses now position the token at the intersection of overlapping support structures, including a three-day trendline, a two-week Gaussian channel, and a long-term triangle retest. Because these overlapping technical models historically mark structural turning points for digital assets, market participants are closely monitoring whether buyers can convert these confluence support levels into a confirmed trend shift.
Analysts are monitoring $1.22, $1.33, and $1.65 as immediate recovery milestones, while broader projections extend toward $3.50, $6.40, $15, and $30 if the macro structure remains intact. A loss of key support, however, could expose the $0.85–$0.88 region.
XRP Holds Above the $1.03 Support Zone
Crypto analyst Dark Defender (@DefendDark), known for publishing long-term XRP analysis, identified the recent low near $1.009. The 23.6% Fibonacci level sits at $1.0344, serving as the first key support. Price has since moved above the 161.8% extension near $1.1090.
The three-day RSI stands at 43.23, above its signal line near 37.11, though it remains below the neutral 50 threshold, indicating that momentum is improving but has not yet confirmed a full trend reversal.
Dark Defender's chart shows XRP compressing between a descending resistance line and a rising support line. A confirmed breakout above this structure could expose $1.1663 and $1.2265, followed by higher targets at $1.33 and $1.88. However, the setup would weaken if XRP loses the $1.0344 level and returns toward the recent low.
Gaussian Channel Signals Potential Bull Switch
ChartNerd's two-week chart places XRP near the lower regression band of a long-term Gaussian channel. The analyst describes this area as a point of control where earlier corrective phases transitioned into stronger repricing cycles. Comparable signals appeared around 2017, 2020, and 2023, aligning with historical crypto market expansion phases that preceded major rallies.
The current bull-switch zone sits near $1.10–$1.14, though ChartNerd cautions that large wicks or liquidity sweeps may occur while price searches for a durable bottom. XRP must move away from the lower band and hold inside the green channel before the signal becomes more reliable. The upper regression area appears near $2.47, but nearby resistance must be reclaimed first. Repeated closes below the lower band would delay the expected channel transition.
Falling Structure Keeps $1.65 in Focus
Dark Defender's chart marks $1.6485 as the primary recovery target. That level aligns with EGRAG Crypto's $1.65 macro trigger and Investor Jordan's weekly Supertrend near $1.5685, forming a major resistance cluster between $1.56 and $1.65.
Before challenging that zone, XRP must first reclaim $1.22–$1.23. A rejection below nearby resistance could return price toward $1.03, while a deeper pullback would expose the $0.85–$0.88 macro support region.
Macro Setup Extends Toward $6.40 and Beyond
EGRAG Crypto's monthly chart shows XRP retesting a breakout from a multi-year symmetrical triangle. In broader technical analysis, retests of multi-year macro breakouts serve as critical validation events, determining whether an asset's long-term bullish structure remains intact. The most critical support sits between $0.85 and $0.88, where the triangle boundary, the White Bridge trendline, and the monthly 111 EMA converge. A brief wick below that range would not automatically invalidate the structure, though sustained monthly closes beneath $0.85 would carry greater significance by placing XRP below multiple long-term support levels and weakening the breakout-retest setup.
EGRAG outlined a staged recovery path through $1.23, $1.65, and the former $3.00–$3.50 resistance region. Measured-move targets sit at $6.40 and $30, while Investor Jordan's weekly chart presents an intermediate path toward $15 or higher. The monthly 21 EMA serves as an additional momentum trigger within that recovery sequence.
This article is for informational purposes only and does not constitute financial or investment advice. Technical indicators, chart patterns, and analyst price targets reflect individual interpretations and do not guarantee future results. XRP and other cryptocurrencies remain highly volatile assets. Readers should conduct independent research and consult a licensed financial adviser before making investment decisions.