XRP Rebounds to $1.03, but Bearish Momentum Puts $1 Support at Risk
Key Takeaways
- •XRP is trading near $1.03 after declining more than 5% over the previous week, with only a modest intraday rebound on Monday.
- •The cryptocurrency remains below its 50-day, 100-day, and 200-day EMAs at $1.10, $1.18, and $1.37, signaling structural weakness across short-, medium-, and long-term timeframes.
- •Momentum indicators including an RSI near 39 and a negative MACD confirm sustained selling pressure, although XRP has not yet reached oversold territory.
- •The $1.00 psychological support level is critical for buyers to defend, as a decisive break below it could accelerate selling and trigger a deeper correction.
- •Reclaiming the 50-day EMA at $1.10 represents the first major resistance hurdle XRP must clear to begin improving its short-term technical outlook.
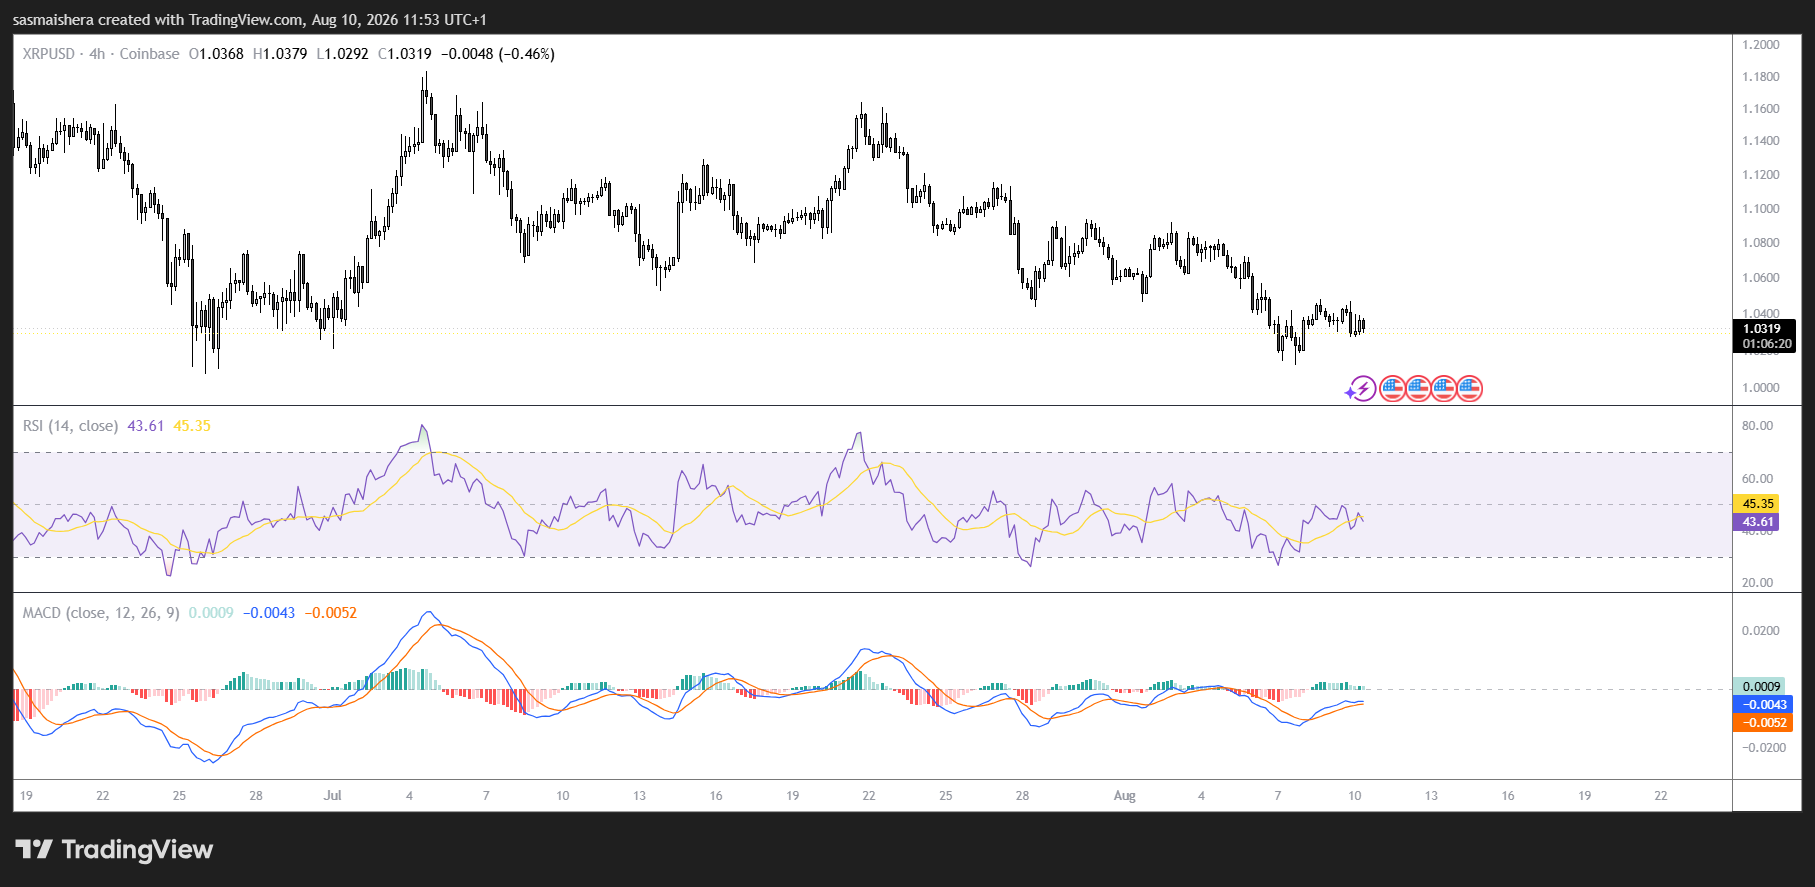
XRP is trading near $1.03 on Monday, marking a modest intraday rebound after a decline of more than 5% over the previous week. The native token of the XRP Ledger, which underpins cross-border payment solutions developed by Ripple, has faced sustained selling pressure amid a broader cooling in digital asset markets. Despite this recovery, the token maintains a bearish near-term technical outlook as it continues to trade below its 50-day, 100-day, and 200-day Exponential Moving Averages (EMAs). Weak momentum indicators further suggest that sellers are largely dictating the broader price trend. The $1.00 psychological level has emerged as a crucial support zone, which buyers must defend to prevent another leg lower. To improve its short-term outlook, XRP will need to reclaim the 50-day EMA at $1.10.
XRP Remains Below Major Moving Averages
Currently, the cryptocurrency sits below the 50-day EMA at $1.10, the 100-day EMA at $1.18, and the 200-day EMA at $1.37. Trading beneath all three major moving averages reflects structural weakness across short-, medium-, and long-term time frames. This positioning establishes a substantial zone of overhead resistance, meaning any upward movement is likely to encounter renewed selling pressure as the price approaches these moving averages. The 50-day EMA at $1.10 represents the first major test for the token; a sustained daily close above this level would be required to suggest that short-term momentum is beginning to improve. Such moving-average levels are widely tracked by active traders, which can amplify their significance as decision points.
Momentum Indicators Signal Persistent Selling Pressure
Momentum indicators also remain bearish despite Monday's slight price recovery. The Relative Strength Index (RSI) stands at approximately 39, which is below its neutral midpoint of 50. While this reading indicates that selling pressure remains dominant, XRP has not yet entered the conventional oversold territory below 30. Additionally, the Moving Average Convergence Divergence (MACD) indicator is in negative territory, reinforcing the broader bearish technical outlook. Together, the RSI and MACD suggest that XRP's current rebound may remain limited unless buyers return with stronger trading volume. Consequently, any short-term rallies could attract further selling while the token remains beneath its major moving averages.
Critical $1 Support Level in Focus
As XRP approaches a critical juncture, the psychological and horizontal support level at $1.00 serves as its most important immediate foundation. Buyers may attempt to defend this area vigorously, as round-number levels historically attract increased market demand. Maintaining a position above $1.00 could allow XRP to consolidate and build the foundation for another attempt at reclaiming its 50-day EMA. Conversely, a decisive daily close below $1.00 would weaken the technical structure and could accelerate selling pressure. Because there is an absence of other specified nearby support levels, a breakdown below $1.00 could expose XRP to a substantially deeper correction as traders search for the next viable demand zone.
Key Resistance Levels for Recovery
To begin reversing its bearish short-term trend, XRP must break above the 50-day EMA at $1.10. Moving from the current price of $1.03 to $1.10 would necessitate a gain of nearly 7%. Clearing this initial moving average could encourage buyers to target the 100-day EMA at $1.18. Should XRP manage a breakout above $1.18, the horizontal resistance level at $1.30 would become the next logical upside target. However, each of these consecutive resistance levels has the potential to attract profit-taking and renewed selling, meaning a sustained recovery is heavily dependent on strong market demand and continuously improving momentum.
The 200-day EMA at $1.37 stands as XRP's most substantial technical barrier. This moving average functions as an essential gauge of the broader market trend, and XRP would need to definitively reclaim it to signal a meaningful shift away from its long-term bearish structure. Beyond the $1.37 mark, the next major resistance level is located around $1.90. This target, however, remains distant while XRP continues to trade below its nearer moving-average barriers. For the immediate term, XRP's recovery trajectory is heavily dependent on its ability to hold the crucial $1.00 support level and systematically navigate through the overhead resistance at $1.10, $1.18, and $1.30.

