XRP Rebounds From $1.20 Into a Wall of Broken Support Near $1.27
Key Takeaways
- •XRP traded at $1.25, up 1.45%, as of 08:55 UTC on Friday, October 30, 2026, after an overnight flush to $1.20.
- •The sell-off was triggered by news of a $6.3 billion hack at Binance, the largest in crypto history and bigger than the roughly $1.5 billion Bybit theft of February 2025.
- •Thursday's breakdown candle pushed XRP below the 200-day SMA at $1.27, the 100-day SMA at $1.30, and the 50-day SMA at $1.39, placing the token in a short-to-medium-term corrective structure.
- •Today's intraday high of $1.27 stalled just short of the 200-day average and the 0.618 Fibonacci level, indicating sellers are defending the broken support zone as resistance.
- •The 14-day RSI stands at 37.44, below its 40.04 signal line with no bullish crossover yet, and the daily close will determine whether XRP tests $1.14 or attempts to reclaim $1.30.
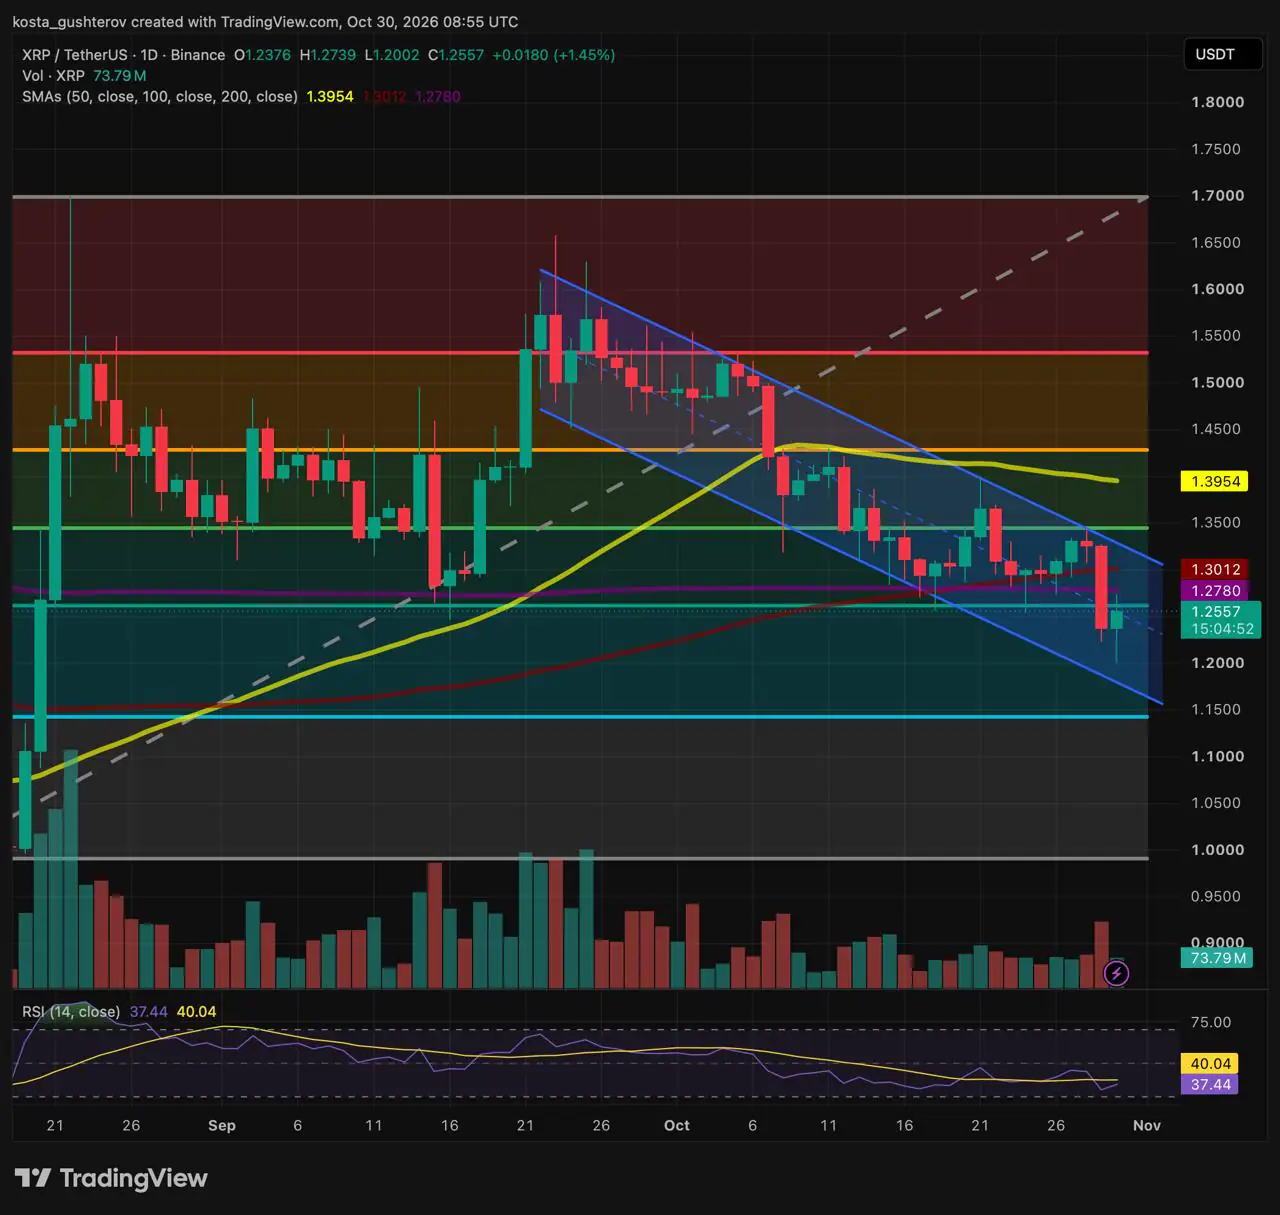
XRP traded at $1.25 as of 08:55 UTC on Friday, October 30, 2026, up 1.45% on the day, according to the Binance XRP/USDT daily chart. The token is staging a rebound from an overnight flush to $1.20, but the recovery has run straight into the cluster of support levels it lost during Thursday's breakdown.
Overnight Flush and Rebound
Today's candle opened at $1.237, right where yesterday's breakdown candle closed. The drop to $1.20 came overnight, after news broke that Binance had suffered a $6.3 billion hack, the largest in crypto history — a breach that dwarfs the previous record, the roughly $1.5 billion theft from Bybit in February 2025 that was also blamed on North Korean hackers. Binance is the world's largest cryptocurrency exchange by trading volume, so developments there tend to move the wider market. The move swept liquidity, flushing stops down to $1.20 before buyers stepped in hard. The rebound carried price up to test the underside of the 0.618 Fibonacci level — the golden pocket — near $1.26, printing an intraday high of $1.27. The candle, still open at 08:55 UTC, has so far traded 73.79 million XRP in volume.
What Changed on Thursday
The bounce follows a sharp breakdown. After a multi-day relief attempt was capped at the upper boundary of a descending channel and the 0.500 Fibonacci level near $1.34, sellers forced a heavy expansion candle lower on Thursday. That candle cut through the golden pocket and both long-term averages — the 200-day SMA at $1.27 and the 100-day SMA at $1.30 — as reports of the Binance hack spread through the market in the evening.
XRP now trades below all three of its main moving averages, including the 50-day SMA at $1.39, placing it in a short-to-medium-term corrective structure. The 200-day average in particular is widely treated as a long-term bull-bear dividing line, which is why its loss alongside the 100-day carries more weight than an ordinary pullback.
That correction has a clear shape. Since the $1.70 August peak, price has moved inside a descending parallel channel. Every rally since late September has been rejected at the upper trendline, while sell-offs have run out of steam near the lower one. Today's flush to $1.20 tagged the lower half of the channel, setting up the current mean-reversion bounce.
Support Turns Into a Ceiling
The three levels that held XRP up earlier this month — the golden pocket, the 200-day SMA and the 100-day SMA — now sit above the price as one dense supply zone. The first retest has already met sellers: today's high of $1.27 stalled just shy of the 200-day SMA at $1.27, a sign that sellers are defending the broken averages.
The long lower wick off $1.20 shows real bids resting near the channel's lower boundary, but it does not undo the damage from losing the 100- and 200-day averages. XRP is now testing the broken golden pocket and the 200-day line from below — a support-to-resistance flip, where a level that once cushioned dips now caps rallies. Unless buyers force a daily close above $1.3012 to reclaim the moving-average cluster and break the channel ceiling, the bounce reads as a relief test. Below that zone, the 0.786 Fibonacci level at $1.14 is the next demand zone.
Momentum Still Favors Sellers
The RSI points the same way. The 14-day reading stands at 37.44, below its 40.04 signal line and well under the 50 midline — the level that separates buyer-controlled from seller-controlled momentum on the 0–100 gauge. The oscillator has hooked up slightly with today's buying, but there is no bullish crossover or divergence yet, leaving sellers in control of the higher-timeframe trend. A crossover back above the signal line, and then the 50 midline, would be the first mechanical sign of that balance shifting — the momentum tell to watch in the sessions ahead.
The Fibonacci Map
The Fibonacci grid on the daily chart runs from the $0.99 August base (the 1.0 level) to the $1.70 peak (the 0.0 level), with each retracement band marking a potential pivot as price rotates between the two extremes.
Where Does XRP Close?
Neither scenario is a call; each depends on where the daily candle settles, with XRP changing hands at $1.25. Because the candle is still open, the UTC daily close — not the intraday tape — is what confirms either branch.
If it closes under $1.26–$1.27: today's green move turns into a retest of broken support. Sellers would return in the $1.26–$1.27 band and push price back toward the $1.20 low. A break below $1.20 would open a slide toward the 0.786 Fibonacci level at $1.1426, where the channel's lower trendline currently sits. This branch stays live while XRP trades below $1.30.
If it closes above $1.30: buyers would build on today's 73.79 million XRP of volume and reclaim both the 200-day and 100-day SMAs, turning yesterday's breakdown into a bear trap. That could squeeze late shorts and bring a test of the channel ceiling and the 0.500 Fibonacci level at $1.32–$1.34. Only a breakout above that ceiling would open a broader recovery toward the 50-day SMA at $1.39.
Zooming Out
Even the lower branch would leave XRP well above the $0.99–$1.0000 base that launched its late-summer breakout, meaning the advance that began in August remains intact. Repairing the broader trend is a taller order: that process only starts once XRP is back above its 50-day SMA.
This article is provided for informational purposes only and does not constitute financial or investment advice. Technical levels and scenarios do not guarantee future price movement. This article first appeared on Coindoo.

