XRP's $1.40 Bounce Fully Reverses as Golden Pocket Support Faces Another Test
Key Takeaways
- •XRP climbed to about $1.40 on Wednesday before surrendering the entire gain over three sessions, with Saturday's decline reaching roughly $1.25 inside the "golden pocket" support zone between $1.24 and $1.26.
- •The token now trades about 26% below its August peak, and its relative strength index has slid to roughly 36, approaching the 30 oversold mark.
- •October's selling has occurred on far lighter volume than the August and September rallies, with no panic-selling spike, and last week's bounce also drew thinner trading activity.
- •The golden pocket has been tested three times since mid-September with progressively weaker rebounds — the first lifted XRP by roughly a third, while last week's managed about 11% before fading.
- •A daily close back above $1.29 could revive the bounce, while a daily close below $1.24 before the end of October could break the pocket and expose the 0.786 Fibonacci retracement near $1.14.
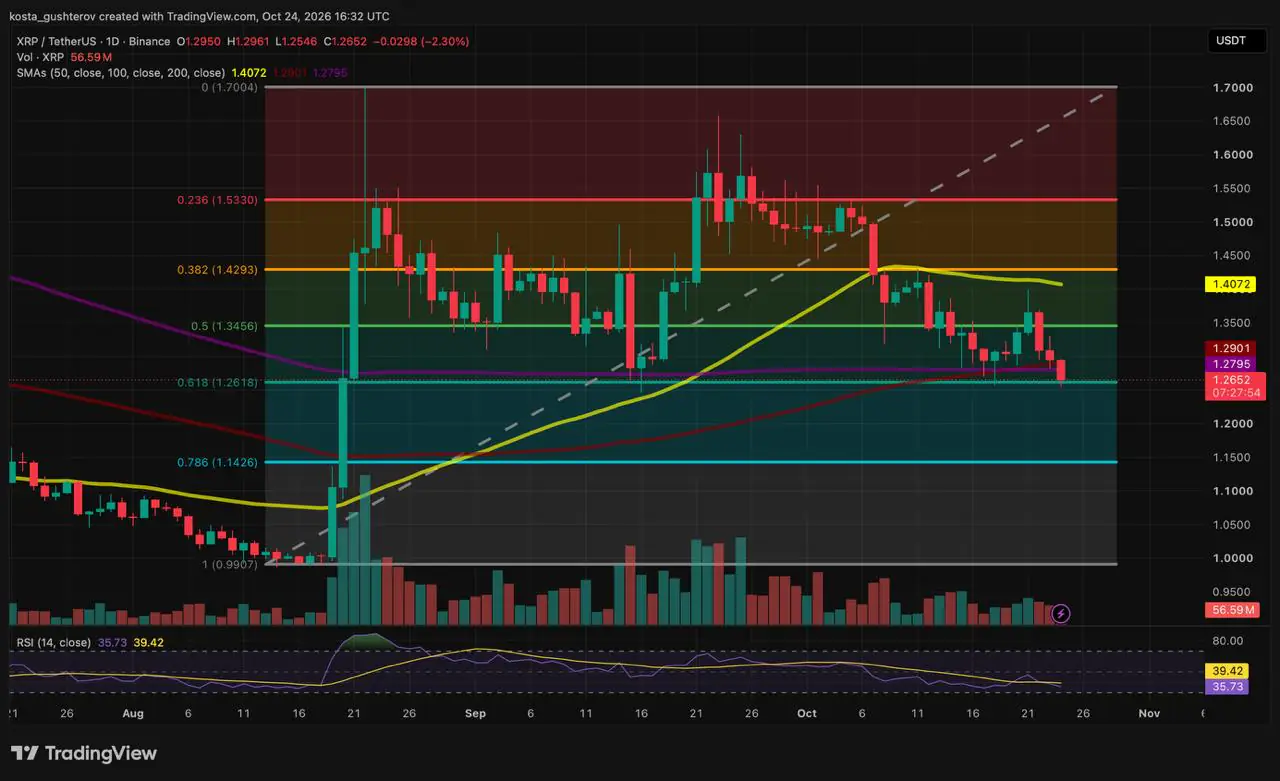
XRP's latest rebound has come undone. After climbing toward $1.40 on Wednesday, the token gave back the entire move over the following three sessions, with Saturday's decline reaching about $1.25 intraday — a touch inside the "golden pocket" support zone that spans roughly $1.24 to $1.26. XRP now sits about 26% below its August peak, and its relative strength index (RSI) has slid to roughly 36, closing in on oversold territory.
Binance's XRP/USDT daily chart on TradingView shows the October slide unfolding on far lighter volume than the August and September rallies, with no panic-selling spike so far, according to a Coindoo analysis published October 24, 2026.
The bounce that did not last
Earlier this week, XRP bounced off the golden pocket, the zone between the 0.618 and 0.65 Fibonacci retracements of its August rally — a tool chartists use to map where a pullback inside a larger trend may lose steam. By Wednesday the move had stretched to about $1.40 before sellers stepped in. They erased those gains over the next three sessions, and Saturday's drop reached about $1.25 intraday, putting price a touch inside the pocket.
Two of three support layers are slipping
Last week, the pocket had backup from the 100- and 200-day simple moving averages (SMAs), which had converged just above it. A daily close beneath them would turn that backup into the first hurdle overhead, only 1% to 2% above the current price.
Each bounce off the floor is getting weaker
The pocket has now been tested three times since mid-September, and the rebounds it has produced are shrinking. The first lifted XRP by roughly a third; last week's managed about 11% before fading.
The highs tell the same story from the other side. Each rally since late September has topped out lower than the one before, while the floor has stayed in the same place. That squeezes price into a narrowing range and puts growing weight on a single level.
Volume points the same way. The September rebound came on some of the heaviest Binance trading of the autumn, while last week's bounce drew far thinner activity. With both the October selling and the latest buying running on light volume, neither side has shown real conviction at the floor yet.
Below the pocket, the chart thins out
If the pocket gives way, the next Fibonacci level is the 0.786 retracement near $1.14, about 10% lower and close to where XRP traded in late July. Beneath that sits the August low near $0.99, the starting point of the entire rally.
The ceiling that stopped Wednesday's rally
Past the two averages, the 0.5 Fib near $1.35 comes first. Above it, the 50-day SMA near $1.41, now curling lower just beneath the 0.382 Fib near $1.43, is the barrier Wednesday's move could not reach. Clearing all of that would still leave the 0.236 Fib near $1.53, the top of the late-September range that gave way in early October.
Momentum is stretched
RSI has slid to about 36, below its signal line and approaching the 30 oversold mark. Selling looks stretched, but an oversold reading on its own does not mark a turn.
The case for a hold
The 0.618 Fib has yet to fail on a daily close, and the 100-day SMA is still rising. A fast move back above the lost averages would make this week's drop look like another shakeout at the same floor.
Potential moves (not a forecast)
XRP sits on the golden pocket, with the - and 200-day SMAs at $1.28–$1.29 overhead. Both scenarios below turn on daily closes — the confirmation many chartists require before treating a level as defended or broken.
- Hold and recover: A daily close back above $1.29 in the coming days could revive the bounce and bring the 0.5 Fib back into play.
- Break: A daily close below $1.24 before the end of October could crack the pocket and expose the 0.786 Fib.
- Bigger picture: XRP still trades about 28% above its August low, and holding the pocket would keep the August uptrend technically intact.
Outside the chart, the next scheduled potential market mover is the Federal Reserve's rate decision on Wednesday, October 28, at 2:00 PM ET — a decision that regularly moves risk assets broadly, including crypto, as traders reprice borrowing-cost expectations.
How we read this chart
Daily XRP/USDT candles from Binance on TradingView, captured at 16:32 UTC on October 24, 2026, with the day's candle still open. Daily candles close at 00:00 UTC. Fibonacci levels run from the mid-August low to the August spike high. Indicators used: the 50-, 100- and 200-day simple moving averages, the 14-day RSI and Binance trading volume.
This article is provided for informational purposes only and does not constitute financial advice. Cryptocurrency prices are volatile.
Source: Coindoo

