XRP Price Prediction: Analysts Debate a Possible Slide Toward $0.63 Support
Key Takeaways
- •XRP traded near $0.89 after falling more than 6% in 24 hours, with analysts identifying $0.88, $0.77 and $0.63 as potential downside support zones if selling pressure continues.
- •Don Wedge identified a broadening range on XRP's six-hour chart with a lower boundary near $0.88 and an upper line toward $1.71, noting a six-hour close below roughly $0.88 would invalidate his setup.
- •CryptoQuant data showed long liquidations exceeded short liquidations by approximately $44 million across Binance, Bybit and OKX on Nov. 14, the largest daily imbalance in 13 months, with Binance accounting for about $21 million.
- •CME Group's XRP and Micro XRP futures reached $81.2 billion in cumulative notional volume during their first 18 months, with roughly 1.9 million contracts traded and average daily notional volume of $216 million through Nov. 16.
- •CME reported an 18.5% share of XRP futures open interest across tracked exchanges per CoinGlass figures from Nov. 19, while Binance's estimated XRP leverage ratio declined from 0.229 on Sept. 22 to 0.118 on Nov. 17.
XRP's price prediction has shifted toward lower support levels after the cryptocurrency fell below $1, with analysts identifying $0.88, $0.77 and $0.63 as potential downside areas as selling pressure continued through November. The decline followed heavy derivatives liquidations, and CryptoQuant reported a $44 million long-liquidation imbalance across three major exchanges on Nov. 14. Meanwhile, CME Group's XRP futures reached $81.2 billion in cumulative notional trading volume, figures that highlighted continued derivatives activity despite weaker spot prices. Read together, the chart readings and derivatives data give traders a map of the levels and market conditions analysts are tracking through November.
XRP Chart Points to $0.77 and $0.63 Support
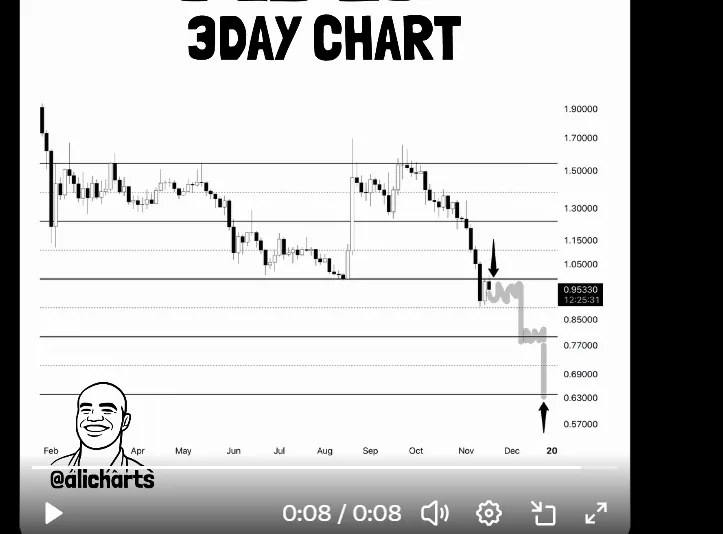
A three-day chart shared by analyst Ali Charts shows XRP struggling to recover from its November decline. A series of bearish candles pushed the price below $1, and the token stood near $0.89, down more than 6% over the last 24 hours.
Two lower horizontal levels stand out on the chart. The first sits near $0.77, while the next lies around $0.63. The chart identifies these prices as areas to watch if XRP continues falling, although neither level represents a confirmed destination. Horizontal levels like these mark prices where buying or selling interest has previously concentrated, and technical traders commonly treat them as zones to monitor rather than guaranteed floors.
Higher on the chart, former price boundaries appear around $1.23 and $1.50. XRP moved between those areas earlier in the year, but the latest decline left both above the current price. A recovery would first need to reclaim $1 before testing those higher levels.
Broadening Range Keeps $0.88 Support in Focus
Analyst Don Wedge offered another view on Nov. 20, as detailed in his post on X. Rather than focusing on horizontal support levels, he identified a broadening range on XRP's six-hour chart, with the lower boundary sitting near $0.88 and the upper line extending toward $1.71.
According to Wedge, XRP's October pennant failed when the price dropped below $1, near the pattern's starting point. He now follows the wider formation that dates back to February. A broadening range is a formation whose boundary lines spread apart over time, and pattern-based traders typically define a close beyond one boundary as the condition that confirms or invalidates the setup. The chart shows a recent decline toward $0.90, followed by a modest recovery to $0.96.
Wedge identified a six-hour close below approximately $0.88 as the condition that would invalidate his setup. If XRP holds that boundary, the upper line near $1.71 remains a possible target, although the price would first need to clear nearby resistance.
XRP Records $44 Million Liquidation Imbalance
The recent price weakness coincided with widespread derivatives liquidations. CryptoQuant data shows long liquidations exceeded short liquidations by approximately $44 million on Nov. 14. The figures cover Binance, Bybit and OKX, with the daily imbalance reaching its highest level in 13 months. Liquidations occur when an exchange forcibly closes a leveraged position whose margin can no longer cover potential losses, so an imbalance weighted toward long closures signals that positions betting on higher prices were unwound in greater proportion as the market fell.
Binance accounted for approximately $21 million of that figure, Bybit recorded $12 million, and OKX contributed another $11 million. These figures measure the difference between long and short liquidations rather than all closed positions. Binance's estimated XRP leverage ratio, a metric that tracks leverage use among its XRP traders, also declined from 0.229 on Sept. 22 to 0.118 on Nov. 17.
CME XRP Futures Volume Reaches $81.2 Billion
CME Group reported $81.2 billion in cumulative notional volume across its XRP and Micro XRP futures during their first 18 months. Through Nov. 16, approximately 1.9 million contracts had changed hands, and average daily notional volume reached $216 million. Volume figures of this kind are often read alongside open interest, the total value of contracts still active, because open interest shows where positions are held rather than how much changed hands.
CME's standard futures contract represents 50,000 XRP, while the smaller version represents 2,500 XRP. Both settle in dollars rather than transferring XRP, so their volume measures futures activity rather than direct purchases of the cryptocurrency.
Citing CoinGlass figures from Nov. 19, CME reported an 18.5% share of XRP futures open interest across tracked exchanges. Because CME's contracts settle in cash, that share reflects derivatives exposure on a regulated venue rather than holdings of the token itself. The activity continued as XRP fell from approximately $2.43 in May 2025 to around $0.95.
For now, the analyst outlook places $0.88 as the nearer support test. A further decline would bring the $0.77 and $0.63 levels into focus. The near-term markers are those the analysts themselves defined: a six-hour close below roughly $0.88 would invalidate Wedge's range, while the horizontal zones near $0.77 and $0.63 remain the levels to monitor if selling pressure persists.
This article provides general financial information, not investment advice. Cryptocurrency prices are volatile, and technical forecasts cannot guarantee future returns. Investors should conduct independent research before making investment decisions.
This article is a rewritten English version of the original report published on The Market Periodical: XRP Price Prediction as Analysts Debate a Possible Slide Toward $0.63 Support.

