XRP Price Tests Key Support After 25% Drop From October Levels
Key Takeaways
- •XRP declined to around $1.16 on November 7, a drop of roughly 25% from its early October level of about $1.55.
- •The selloff coincided with the liquidation of more than $10 million in leveraged long positions and a 12.36% decline in XRP futures open interest.
- •Analysts have outlined a ladder of potential support levels: a $1.16-$1.04 demand zone per ChartNerd, $1.12 per Dark Defender, and $0.99 per Ali Martinez.
- •ChartNerd noted that XRP broke below a 10-week support floor, trades under its 20- and 50-week moving averages, and would need to reclaim $1.34 to change the technical picture.
- •XRP ETFs have recorded approximately $1.81 billion in cumulative net inflows, though flows have been nearly flat since a modest net outflow on November 2.
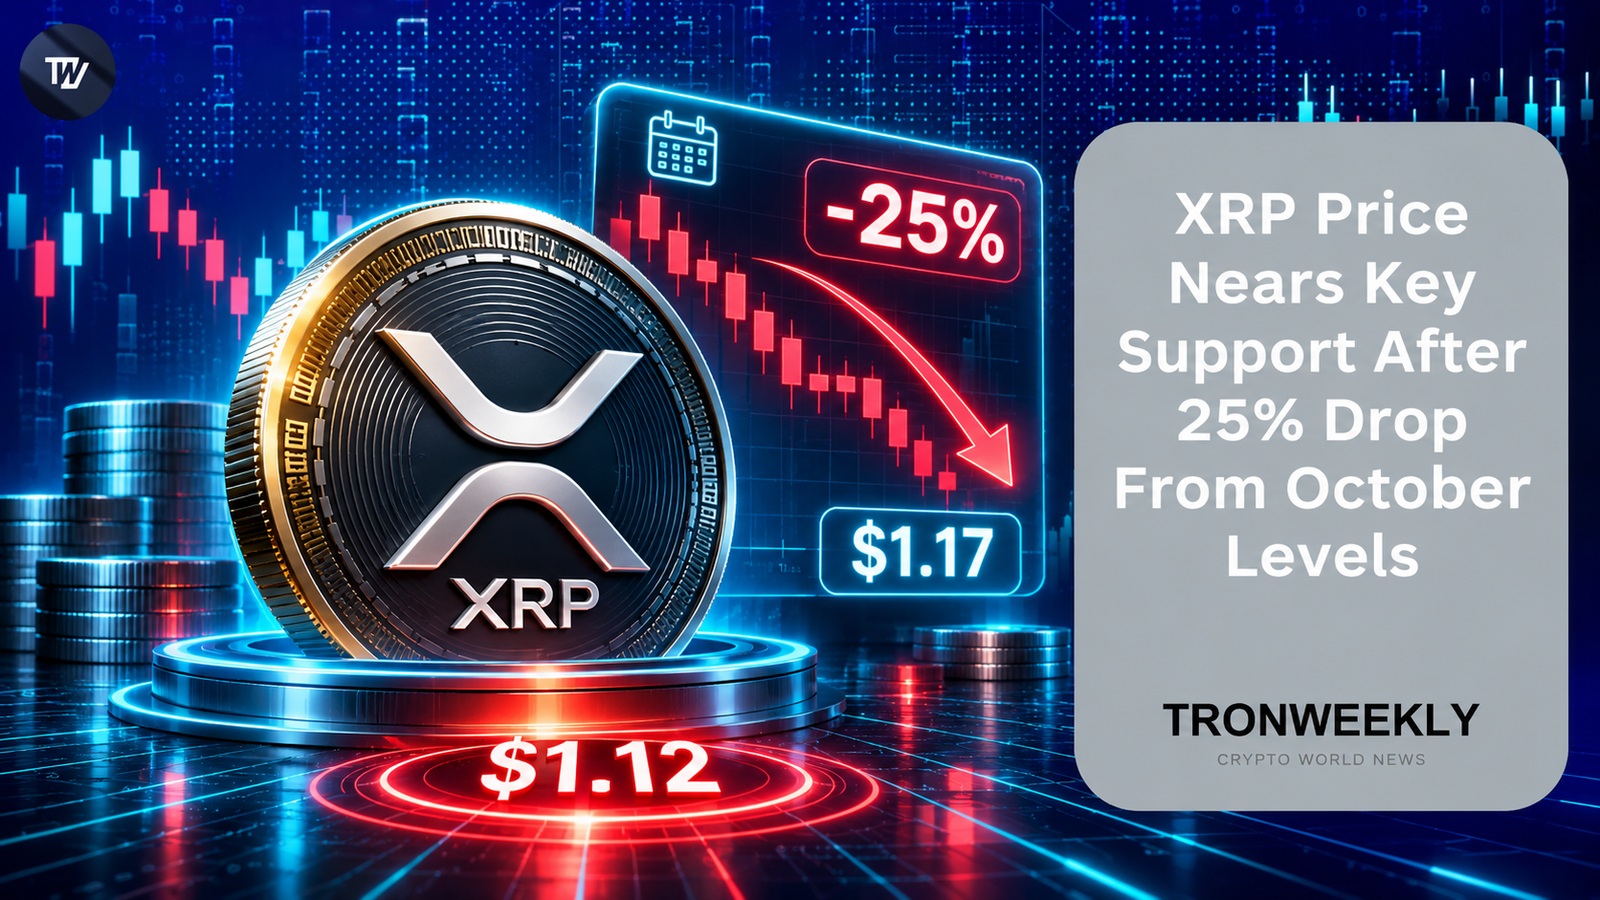
XRP traded near $1.16 on November 7 after a steep decline from an early October level of roughly $1.55. The drop, which amounts to about 25%, has coincided with liquidations of leveraged long positions and weakening market sentiment, and several analysts have published charts pointing to possible support zones below the current price.
Analyst ChartNerd has identified a demand zone between $1.16 and $1.04, while Ali Martinez pointed to a lower boundary near $0.99. Other traders see room for stabilization: Dark Defender said the broader technical structure remains intact, with $1.12 the level that buyers need to defend. Each scenario hinges on whether buyers step in at these levels in the sessions ahead.
Selling Pressure Builds as Leveraged Longs Unwind
The token was changing hands around $1.17 at the time of reporting, according to CoinMarketCap data, down sharply from the levels recorded earlier in the quarter. Figures from CoinGlass indicate that more than $10 million in leveraged long positions were liquidated during the selloff. Liquidations occur when an exchange forcibly closes a leveraged position that no longer meets its margin requirement, converting it into sell orders that can add to a decline already underway.
Open interest in XRP futures dropped by 12.36% over the same period. The metric, which measures the number of open futures contracts, declined as traders exited their positions and forced liquidations added to the selling. Because it counts contracts rather than price, open interest is used to distinguish moves backed by fresh positioning from those driven by existing trades being closed out.
The loss of the $1.21 area compounded the pressure on an already weak weekly chart, since it removed the nearest layer of support from the picture. With XRP trading below that level on November 7, market participants were left waiting to see whether fresh demand would emerge around $1.16.
Where XRP Could Find Support
Analyst ChartNerd said the token has broken below a support floor that held for 10 weeks and is now searching for a demand zone between $1.16 and $1.04.
The moment of truth: ripple:native has broken below its 10-week support floor and is searching for a $1.16-$1.04 demand zone. The double-top structure aligns with earlier-year highs, while price remains capped by key moving averages (20/50W), suggesting a constructive corrective… pic.twitter.com/jNEFb03cYs
— 🇬🇧 ChartNerd 📊 (@ChartNerdTA) November 6, 2026
Source: ChartNerd on X
In the same analysis, ChartNerd identified a double-top pattern at the earlier-year highs and noted that price remains below the 20-week and 50-week moving averages, which he interpreted as a sign that the corrective process is still underway. He flagged $1.34 as the level that would change the technical picture if XRP manages to break back above it, while acknowledging that such a move would be difficult to achieve from current levels.
Ali Martinez offered a more cautious reading. According to his post on X, XRP has moved out of the midpoint of its trading channel, leaving the lower end of that channel near $0.99.
Why $1.12 Matters to the XRP Outlook
Trader Dark Defender laid out a different scenario in a November 6 post on X. He argued that $1.12, which acted as a resistance zone in July and August, should now be defended as support. The analyst has previously identified both $1.21 and $1.12 as supportive zones, and he maintains that the broader technical structure remains intact as long as buyers hold the $1.12 level. A failure to defend it would undermine that view. The resistance-turned-support approach is a standard technical analysis framework, in which levels where sellers previously emerged are tracked for potential buyer interest on a revisit.
Taken together, the analyses map out a ladder of nearby levels. ChartNerd is monitoring the $1.04-$1.16 demand zone, Dark Defender is focused on the defense of $1.12, and Martinez sees $0.99 as the next significant boundary if the channel thesis plays out.
What XRP ETF Flows Show About Demand
Despite the price weakness, XRP ETFs have collected roughly $1.81 billion in cumulative net inflows, according to ETF flow tracker data from CoinGlass and SoSoValue. The only exception in recent sessions was a modest day of net outflows on November 2, and multiple trading sessions since then have shown almost no net activity. Net inflows tally money moving into the funds minus what leaves them, so the figures capture demand routed through ETF products rather than through exchange trading — a separate channel from the spot price action described above.
The near-term outlook for XRP therefore depends on how the market responds at the identified support levels. A successful defense could help stabilize price action, while further losses would keep the lower technical levels flagged by analysts in focus. Daily ETF flow figures are the other data point to follow, given the near-zero net activity recorded since the November 2 outflows.
This article contains market analysis and price projections. These are not guarantees of future performance. Crypto markets are volatile — always do your own research. This is not financial advice.
Source: Tron Weekly

