XRP Price Tests $0.99 Support as Analysts Split on $0.80 Downside Risk
Key Takeaways
- •XRP is trading near $1.03, down 14.50% over seven days and 1.33% in 24 hours, with roughly $2.03 billion in 24-hour trading volume, according to CoinGecko data.
- •Analyst Ali Charts warned that losing the $0.99 channel-floor support could extend XRP's correction toward $0.80, a conditional scenario rather than a confirmed price target.
- •Crypto With Gopal identified a potential double bottom on the daily chart at $1.00, stating that a breakout above $1.70 could open a path toward $2.50.
- •CasiTrades pointed to Fibonacci support around $1.00 and signs of exhausting selling momentum, while noting Bitcoin is nearing major support near $69,000.
- •Analyst scenarios converge on the $0.99–$1.00 band, making a sustained hold or breakdown at that level the key marker for XRP's next directional move.
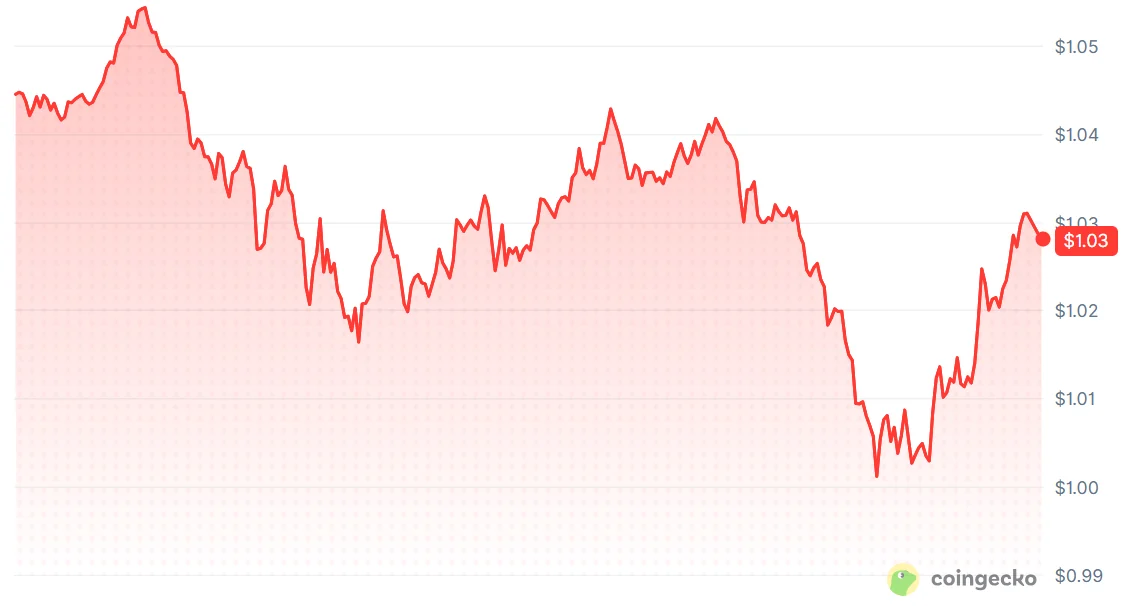
XRP, the native token of the XRP Ledger, is trading near $1.03 after a decline that has now extended across a full week, placing the token directly on a support zone that several analysts identify as the decisive level for its near-term direction.
The slide has produced split readings among chart analysts posting on X. One warns that a deeper correction toward $0.80 remains possible if a key support level fails, while others point to early signs that selling momentum may be fading. All of those scenarios converge on the same $0.99–$1.00 area.
Data from CoinGecko shows XRP down 1.33% over the past 24 hours and 14.50% across seven days, with 24-hour trading volume of $2,031,576,880 — roughly $2.03 billion. The token's most recent 24-hour low tested the $0.99–$1.00 range. While current price data does not establish a sustained break below the channel's lower boundary, the weekly decline indicates that selling pressure has extended beyond a single trading session.
Ali Charts: $0.99 Must Hold or a Drop Toward $0.80 Comes Into View
Analyst Ali Charts said XRP failed to break above $1.55 resistance at the top of its trading channel and has since completed a full reversal toward the channel's lower boundary near $0.99. A trading channel is a chart structure in which price moves between two parallel boundaries, with the upper line capping advances and the lower line marking support. A three-day chart shared by the analyst on X marks the token near $1.03 and identifies $0.99 as the next important support level — a boundary that now sits close to the $1.00 area that other analysts are monitoring.
XRP REVERSES ALL GAINS
It happened. $XRP failed to break above the $1.55 resistance at the top of the channel and has now completed a full reversal toward the channel’s lower boundary at $0.99.
Now, $0.99 must hold.
If XRP loses this support, the correction could extend… pic.twitter.com/hf3DPgaS9m
— Ali Charts (@alicharts) November 13, 2026 (post)
Ali warned that losing the $0.99 level could expose XRP to a further dip toward $0.80. That projection is a conditional downside scenario that depends on support near $0.99 failing; it is not a confirmed price target or a guaranteed next move. For now, the immediate question is whether buyers can defend the area around $1.00.
Crypto With Gopal: A Potential Double Bottom Near $1.00
In a separate post on X, analyst Crypto With Gopal said XRP is printing a potential double bottom on the daily chart, with the price retesting the $1.00 support zone where buyers have stepped in during previous tests.
$XRP / USDT
XRP is printing a potential Double Bottom formation on the daily chart
Price is retesting the $1.00 support zone, where buyers have stepped in before. Holding this level could trigger a bullish reversal and a fresh momentum shift
A breakout above $1.70… pic.twitter.com/mcQ3UINMNK
— Crypto With Gopal (@cryptowithgopal) November 13, 2026 (post)
A double bottom develops when price tests a similar low twice, a pattern that can suggest sellers are losing control of the market. The formation remains potential rather than confirmed. Chart technicians generally treat such a pattern as confirmed only once price breaks above the high that forms between the two lows, which is why analysts often attach explicit breakout levels to their bullish scenarios. Gopal argued that holding the $1.00 level could support a bullish reversal and a fresh shift in momentum, and identified a breakout above $1.70 as the move that could open a path toward $2.50.
CasiTrades: Fibonacci Support and Fading Selling Pressure
Analyst CasiTrades also wrote on X that XRP may be approaching a bottom, pointing to Fibonacci support around the $1.00 level and describing selling momentum as showing signs of exhaustion. Fibonacci retracement levels are horizontal zones derived from ratios of the Fibonacci sequence, a widely used tool for mapping where price may find support or encounter resistance. The analyst additionally noted that Bitcoin is nearing major support around $69,000 — a level that draws wider attention because Bitcoin, as the largest cryptocurrency by market capitalization, is frequently used as a reference point for conditions across the broader market.
Those observations represent an optimistic interpretation of the charts rather than proof that the decline has ended. They stand in contrast to Ali Charts' warning that a failure at $0.99 could extend the correction, and they leave the $1.00 area as the market's immediate technical battleground.
Why the $0.99–$1.00 Zone Matters
Support is a price area where buyers have previously absorbed selling, while resistance is an area where sellers have previously limited advances. Traders watch these levels closely because a sustained move through either boundary can change the market's technical outlook. Round-number zones such as $1.00 tend to carry additional weight in market commentary because they offer clear, easily tracked reference points. In XRP's current setup, the channel floor identified by Ali Charts and the $1.00 support zone cited by Gopal and CasiTrades converge in the same $0.99–$1.00 band, concentrating attention on a single price area.
The next move in the XRP price therefore depends on how the token behaves around that support. In the sessions ahead, the observable markers are concrete: whether subsequent price data shows lows holding inside the $0.99–$1.00 band or a sustained break below it, and whether buyers can reclaim the $1.55 channel resistance Ali Charts flagged or clear the $1.70 breakout level Gopal tied to a potential advance toward $2.50. A sustained hold could keep the double-bottom scenario in play, while a breakdown would strengthen the bearish case laid out by Ali Charts. Until one of those outcomes develops, $0.99–$1.00 remains the level traders are watching most closely.

