Post-Midterm Selloff Drags XRP to $1.15 as Whales Accumulate and Analysts Eye Key Support
Key Takeaways
- •XRP fell roughly 25% from an early October level near $1.55 to trade around $1.17 on November 7, breaking below the $1.21 support level.
- •The decline liquidated more than $10 million in leveraged long positions and cut futures open interest by 12.36%, with over $1 billion in crypto derivatives wiped out on November 5 alone amid a 5.5% Nasdaq drop.
- •Analysts identified a cluster of potential support levels, including a $1.04–$1.16 demand zone, $1.12, and $0.99, while a climb back above $1.34 could change the technical picture.
- •On-chain data showed whales accumulating more than 16.46 million XRP over five days as the price dropped from $1.34 to $1.15.
- •US spot XRP ETFs recorded about $529,500 in net outflows from November 2 to 6, and October inflows of $18.8 million fell sharply from September's $121.4 million.
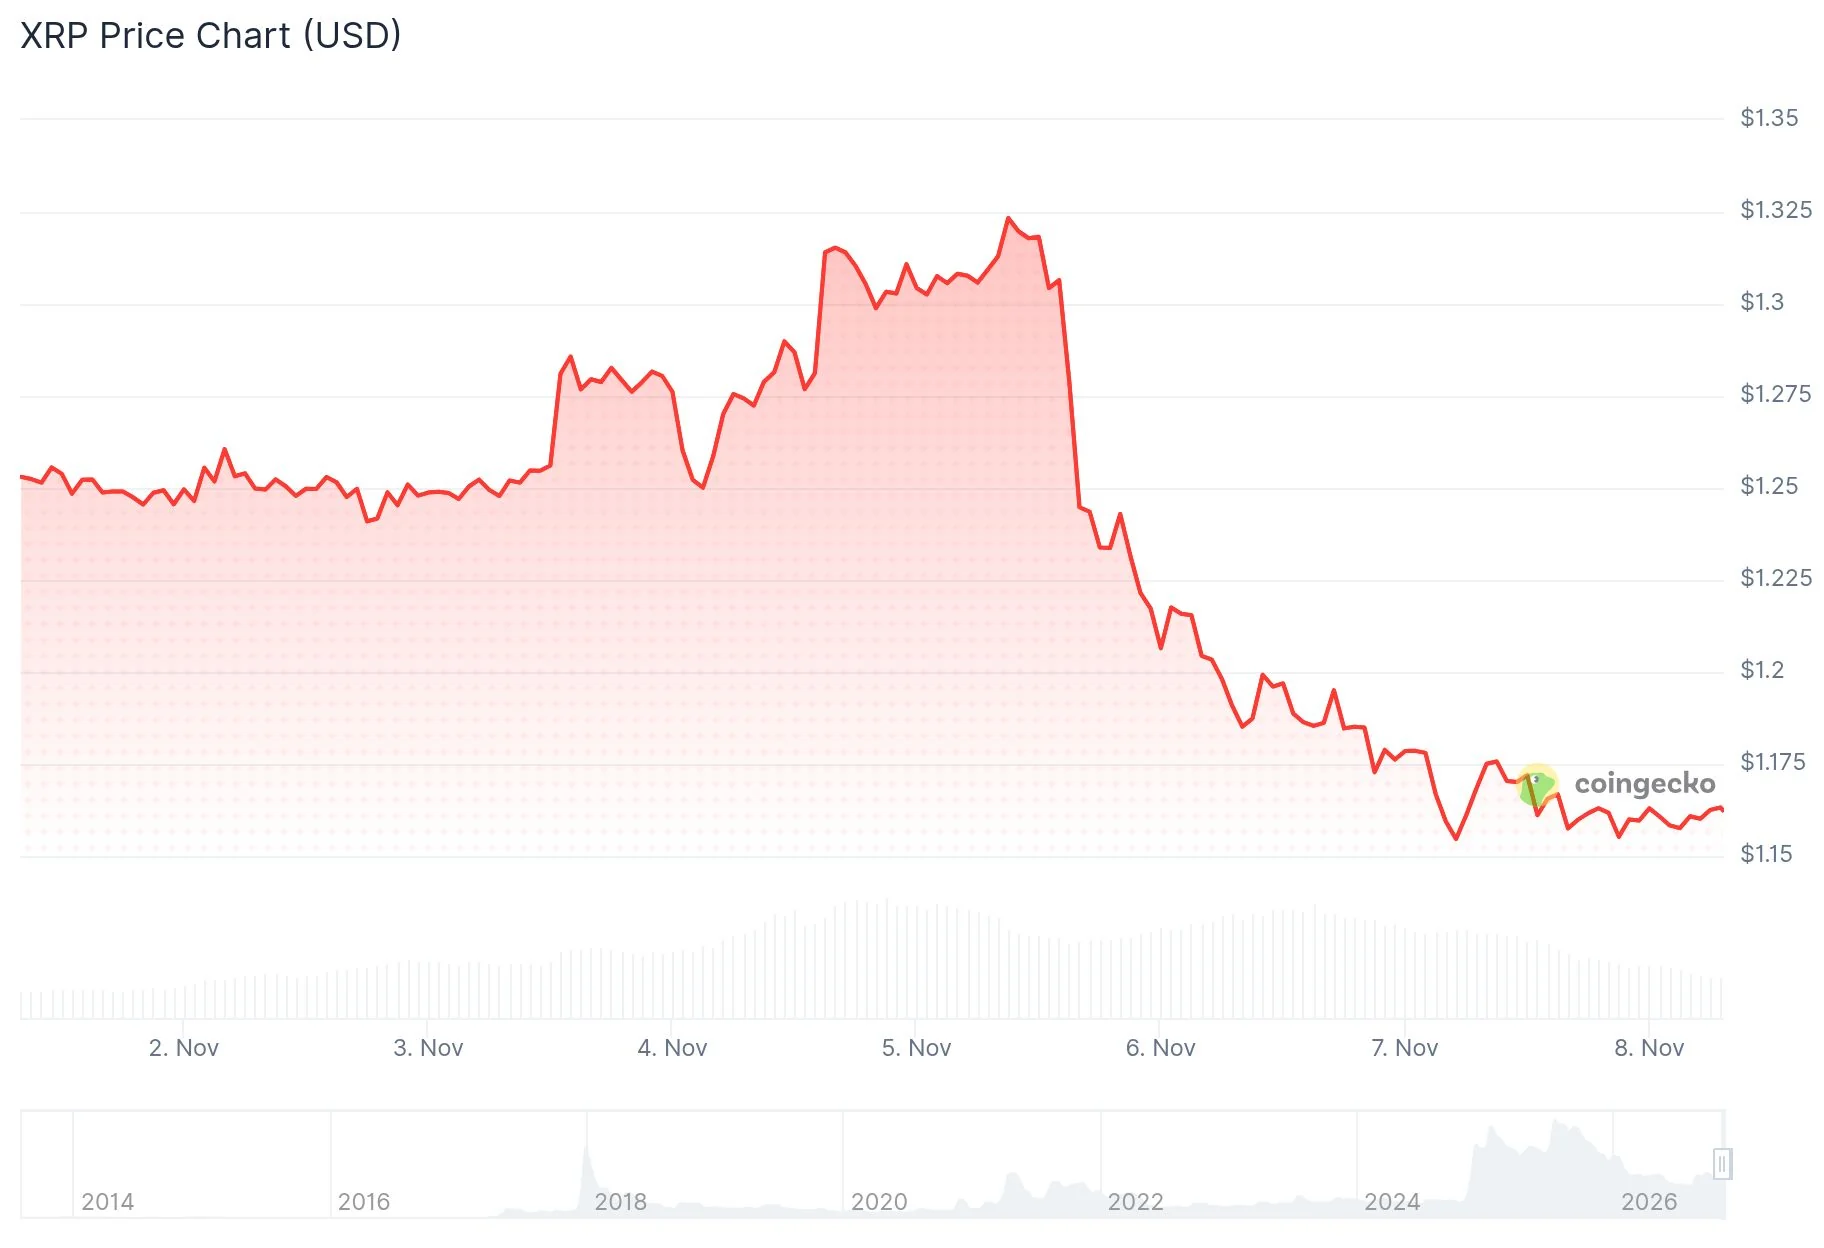
XRP traded near $1.17 on November 7, extending a selloff that has followed the November 3 United States midterm elections. The token is down about 25% from an early October level near $1.55 and has lost roughly 17.4% over the past 30 days, as renewed selling across equities and digital assets weighed on prices.
The decline has been accompanied by heavy derivatives liquidations. CoinGlass data showed that more than $10 million in leveraged long positions were wiped out, while open interest, which counts the number of open futures contracts, fell 12.36%. The selloff also pushed XRP below $1.21, a level that had been flagged as support.
What Pushed XRP Lower
The latest leg down came after the midterm elections on November 3. A short recovery attempt faded, and selling returned across the crypto market. On November 5, the Nasdaq Composite fell 5.5%, and XRP lost about 5.5% in 24 hours.
Concerns about artificial intelligence spending and data-center expansion weighed on market sentiment during that session. More than $1 billion in crypto derivatives positions were liquidated that day, with most of the losses coming from bullish bets.
Bitcoin has since steadied near $76,000. XRP, however, has not drawn enough new demand to reclaim its nearby resistance, leaving the token searching for a floor.
Analysts Track a Cluster of Support Levels
Three analysts outlined different scenarios for where XRP could find support, with a $1.04–$1.16 demand zone in focus and $1.12 and $0.99 also flagged.
Analyst ChartNerd said XRP broke a support floor that had held for 10 weeks and is now searching for a lower base. He marked a demand zone between $1.16 and $1.04 and pointed to a double top near earlier-year highs.
The moment of truth: ripple:native has broken below its 10-week support floor and is searching for a $1.16-$1.04 demand zone. The double-top structure aligns with earlier-year highs, while price remains capped by key moving averages (20/50W), suggesting a constructive corrective… pic.twitter.com/jNEFb03cYs
— 🇬🇧 ChartNerd 📊 (@ChartNerdTA) November 6, 2026 — source post on X
XRP is still trading below its 20-week and 50-week moving averages. ChartNerd read this as a sign that the correction is still running. He named $1.34 as a level that could change the picture if the price climbs back above it.
Ali Martinez took a more cautious view. He said XRP has left the middle of its trading channel, and the bottom of that channel now sits near $0.99.
Whales Accumulate as the Price Falls
On-chain data points to buying among large holders even as prices slide. Analyst Ali Charts reported that whales went on a buying spree as XRP dropped from $1.34 to $1.15, adding more than 16.46 million XRP over five days. Accumulation by large wallets during a drawdown is a divergence on-chain analysts watch closely, because it shows where sizable holders are adding while prices fall — though such buying does not on its own mark a bottom.
XRP WHALES ARE BUYING THE DIP
While $XRP dropped from $1.34 to $1.15, large entities went on a buying spree.
Over the past five days, whales accumulated more than 16.46 million XRP.
Price is falling. Whales are buying. pic.twitter.com/R5njv2LtuF
— Ali Charts (@alicharts) November 7, 2026 — source post on X
Dark Defender offered another view in a November 6 analysis. He noted that $1.12 acted as resistance in July and August and argued that buyers now need to defend it as support. Dark Defender had previously marked $1.21 and $1.12 as support zones and cautioned that a failure at those levels would weaken his case. The three analysts are therefore watching different levels as the token searches for a base.
ETF Flows Cool
US spot XRP ETFs recorded about $529,500 in net outflows from November 2 to 6, according to SoSoValue data. Monday accounted for the entire withdrawal, and the next four sessions showed zero net flows, leaving recent net activity across the funds nearly flat. Spot-ETF flow figures are widely used as a gauge of institutional participation, since they capture net money entering or leaving the funds each session.
October inflows also slowed. They came in at $18.8 million, down from $121.4 million in September. Cumulative net inflows stand near $1.81 billion, and the funds held about $1.34 billion in combined net assets at the end of the week.
Momentum and Key Technical Levels
With momentum fading and fund flows quiet, analysts are mapping a series of nearby support and resistance levels for the token.
Momentum indicators remain weak. The daily relative strength index (RSI) was 29 on November 7, a reading conventionally described as oversold territory, while both the MACD line and its histogram are negative.
The nearest area to watch is $1.15–$1.14. Daily closes below that band could open a move toward $1.12, a monthly support pivot, followed by the $1.10 round number. Below those levels, the $1.00–$0.99 zone comes into view, with a second monthly pivot sitting near $0.981.
On the upside, buyers first need to recover the $1.20–$1.22 area. A stronger recovery would require trading above $1.25–$1.27, where the daily 20-period exponential moving average sits near $1.27. Alongside those chart levels, upcoming daily ETF flow reports and continued on-chain tracking of whale balances offer further readings on where demand is forming.
XRP was changing hands near $1.17 at the time of writing on November 7.

