XRP Holds Near $1.35 as Whale Distribution and Weak Network Activity Pressure Price
Key Takeaways
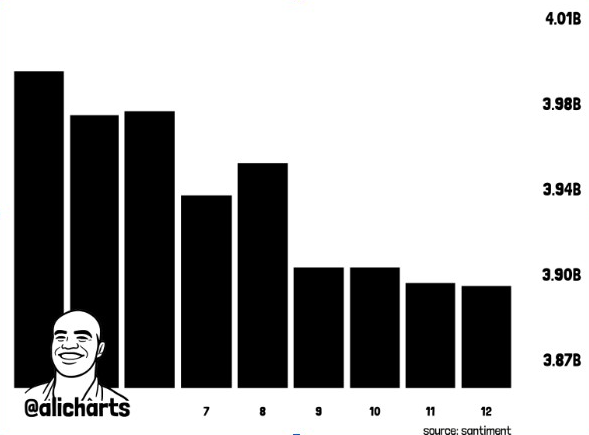
- •Daily active XRP addresses dropped 90.18%, from 388,492 to 38,163, according to Santiment data cited by analyst Ali Charts.
- •Large holders reportedly sold or redistributed roughly 90 million XRP over the past week, with profit-taking cited as one factor behind the distribution.
- •U.S. spot XRP ETFs absorbed more than 11 million tokens during the four-day trading week, including over 3 million on Friday, with Bitwise leading the group.
- •XRP has been rejected near $1.50 approximately five times on the daily chart, while support sits near $1.30, a level closely matching the six-month rolling VWAP.
- •Ali Charts suggested XRP could move toward $1.60 and potentially $1.68 if the $1.35 support holds and the price reclaims the 100-day EMA near $1.38.
XRP traded near $1.36 on Sept. 12 after another volatile session, remaining close to the $1.35 support zone despite briefly falling toward $1.32. The latest correction has coincided with weaker network activity and reported selling or redistribution by large holders.
Daily active XRP addresses declined from 388,492 to 38,163, a 90.18% reduction, according to Santiment data cited by analyst Ali Charts. Large holders also reportedly sold or redistributed roughly 90 million XRP over the past week. Profit-taking was cited as one factor behind that distribution.
At the same time, U.S. spot XRP exchange-traded funds continued to attract intermittent inflows despite weakness in the spot market. XRP ETFs reportedly absorbed more than 11 million tokens during the brief four-day trading week. More than 3 million XRP was attributed to Friday alone, while Bitwise continued to lead the group. These flows provide a separate demand indicator, but the reported data does not establish that they offset whale distribution or weaker network activity.
Market participants are watching whether XRP can defend $1.35 and recover above nearby moving averages. A break below that support could put $1.30 in focus, while a recovery could return attention to the $1.45–$1.50 resistance zone.
XRP’s Price Trend Over the Past Seven Days
XRP has remained under pressure during the past week, following a series of losses over the previous three weeks. The token previously traded near $1.70 before declining toward $1.35, representing a correction of roughly 20% based on figures cited by Ali Charts.
The decline has pushed XRP toward the lower end of its recent trading range. Price has repeatedly struggled around $1.50, which has acted as resistance several times and rejected XRP approximately five times on the daily chart.
Support is positioned near $1.30, a level that closely matches the six-month rolling volume-weighted average price (VWAP). XRP is therefore trading between a defined support area and a resistance zone, with buyers defending the lower boundary and sellers continuing to appear closer to $1.50.
The $1.35 area has also drawn attention because of earlier trading activity. Approximately 2.29 billion XRP previously changed hands near that level, making it a notable short-term price-structure area. A failure to close below $1.35 could keep that zone in focus, while a break lower could shift attention toward additional support and liquidity levels.
Whale Activity and XRP On-Chain Data
The price decline has developed alongside a sharp reduction in XRP network activity. The fall in daily active addresses indicates that fewer addresses were active during the correction, according to the cited Santiment data.
Whale activity changed during the same period, with large holders reportedly selling or redistributing around 90 million XRP as the price moved from higher levels toward the $1.35 support area. The reported activity has been associated with profit-taking, although the source does not identify the individual holders involved.
XRP ETF Flows and Liquidity Levels
The reported ETF inflows occurred while XRP’s spot price remained below resistance. Liquidity data shows major pools both above and below the current price. The primary upside concentration is located between $1.72 and $1.85, while a substantial downside cluster remains between $0.92 and $1.05.
XRP is currently positioned between those two major liquidity areas. The first upside barrier remains near $1.45–$1.50, and a move through that zone could bring the higher liquidity concentration closer to the market price. On the downside, a loss of the recent range lows could return the $1.00 region to focus as the main deeper liquidity target.
Technical Levels and Analyst Forecast
The 100-day exponential moving average (EMA), near $1.38, is one of the closest technical levels above the current price. XRP would need to reclaim that level to improve its short-term momentum.
Ali Charts said XRP could move toward $1.60 and potentially $1.68 if the $1.35 support holds. The cited forecast also requires XRP to recover above $1.38. A stronger technical shift would require the token to clear the $1.50 resistance zone, which has limited several previous recovery attempts.
If buyers reclaim $1.50, attention could move toward $1.70 and the liquidity zone above it. The $1.80 area would then become another level to monitor. Conversely, a decline below $1.35 would make the current structure more vulnerable. A break below $1.30 would increase downside pressure, with lower liquidity concentrated around $1.00.
Source: The Market Periodical
Ali Charts’ cited data and analysis: X
