XRP Sinks Toward $1.14 as Bull Trap Confirms After $1.33 Rejection
Key Takeaways
- •The November 5 daily close near $1.21 fell below both the 0.618 Fibonacci level and the 200-day simple moving average, confirming the bull trap flagged in earlier analysis.
- •XRP has declined 12.5% since its rejection near $1.33, and the $1.20 support level gave way in a single session on November 6.
- •The initial reversal occurred during a market-wide unwind as Bitcoin fell below $76,500, but XRP's subsequent slide continued on its own while Bitcoin held near $75,700.
- •The 14-day RSI stands at 31.41, just above the oversold threshold of 30, while daily candles have shrunk and intraday volume has run well below November 5 levels.
- •XRP faces two supports roughly three cents apart at the 0.786 retracement near $1.14 and the channel's lower rail near $1.11, with a confirmed close below $1.14 potentially exposing $1.05 and then the August base near $0.99.
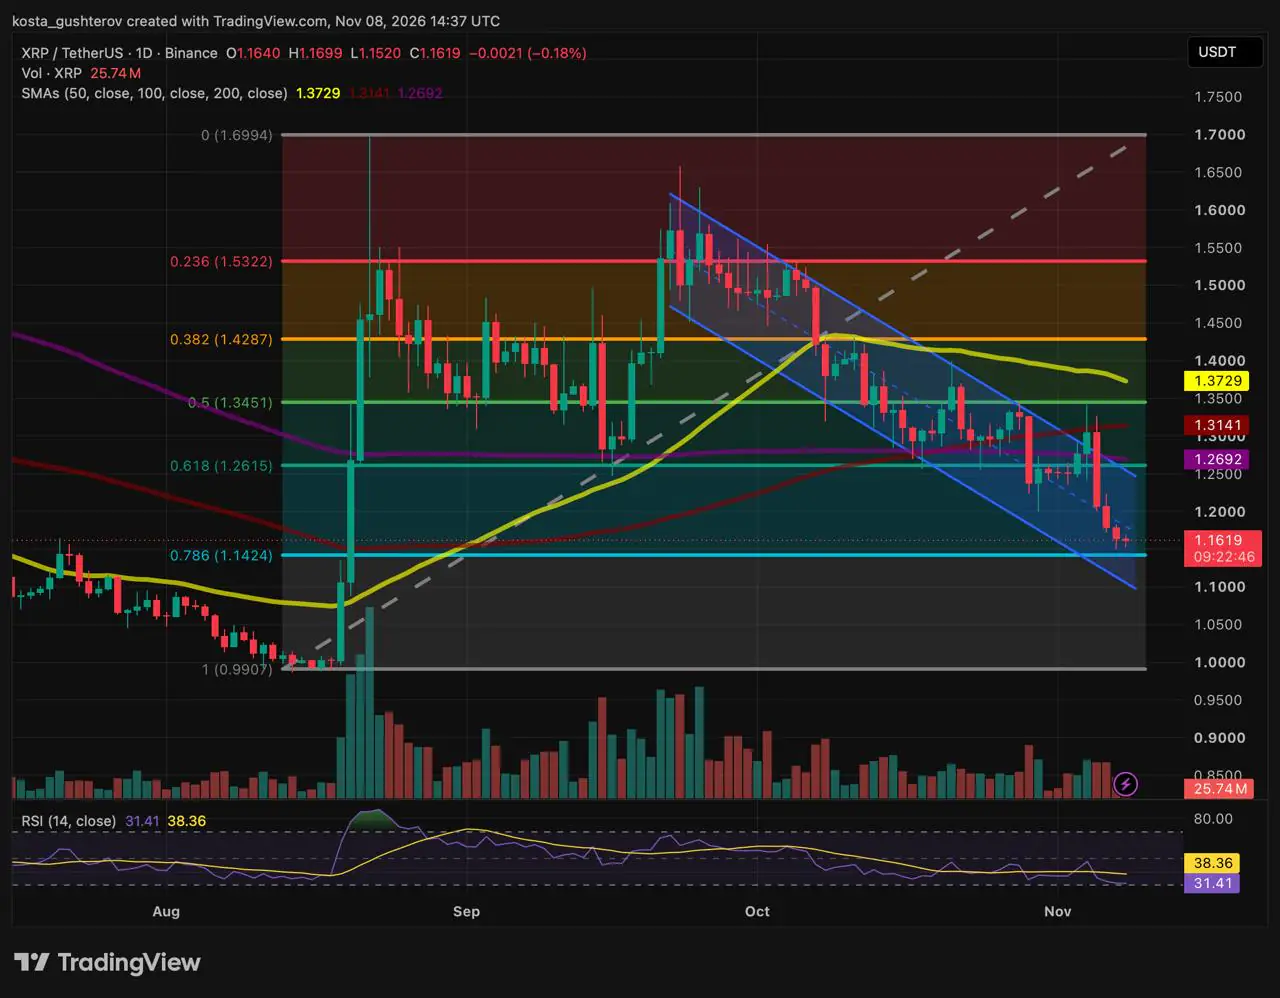
XRP traded at $1.16 on the Binance daily chart at 14:37 UTC on November 8, down 0.18% on the day, after the failed breakout above its 200-day simple moving average (SMA) — a long-term trend line traders watch for the broader cycle — fully unwound into a bull trap. Buyers who chased XRP above the 200-day were left holding positions below it, and the speed of the drop toward the 0.786 retracement fits those positions being closed. The token has fallen 12.5% since the rejection near $1.33, and the selling has now started to slow.
Coindoo's November 5 analysis set the test after XRP was rejected near $1.33: a daily close under the 0.618 level near $1.26 and the 200-day SMA could confirm a bull trap. That condition was met, and the price has since stalled just above the 0.786 Fibonacci retracement.
The November 5 close confirmed the trap
The November 4 candle cleared the channel's upper rail and the 200-day SMA but closed near $1.31, just under the 100-day SMA. On November 5, XRP pushed as high as $1.33 into the 100-day, then reversed. The red candle that followed wiped out the previous day's gain and closed near $1.21, inside the channel and below both the 0.618 level and the 200-day. The retracement levels are standard Fibonacci ratios used to map how far a pullback may run, measured from the August low near $0.99 to the late-August high near $1.70.
The reversal itself came during a market-wide unwind, covered in Coindoo's report on Bitcoin falling under $76.5K, but the slide after it did not. Bitcoin closed near $75,700 on both November 6 and November 7, while XRP gave up about four more cents.
$1.20 went in one session
In late October, XRP dipped to $1.20 intraday and closed well above it. At the time, the 200-day SMA and the 0.618 level had only just been lost, and buyers at $1.20 could still bet on a quick return above them. The November 4-5 failure showed that return being sold, which left the floor without the same backing.
On November 6, the candle opened at that floor, slid to a low around $1.17 and closed near $1.18, below the channel's midline as well. The $1.20 support gave way in a single session.
Selling slows at the 0.786
The November 5 collapse was followed by a smaller red candle on November 6 and a smaller one again on November 7. Today's candle, which opened at $1.16, has stayed within a range of under two cents, from $1.15 to $1.17.
Volume from November 5 to 7 held at similar levels on the chart, so any slowdown shows up only in today's session. By 14:37 UTC, with more than nine hours left, about 25.7 million XRP had traded. On November 5, the count stood near 68.6 million by 16:37 UTC, with roughly seven hours to go.
The 14-day relative strength index (RSI), a momentum gauge scaled from 0 to 100, reads 31.41, just above the 30 mark conventionally treated as oversold. It sits 6.95 points under its signal line at 38.36, a gap that has opened from less than a third of a point on November 5 and reflects four days of seller control.
The floor has split in two
On November 5, the 0.786 retracement and the channel's lower rail sat together near $1.14. The channel, drawn from the late-September highs, has since dropped by about a cent a day, and its lower rail now runs near $1.11. XRP faces two supports roughly three cents apart.
If the selling is a breakout unwind running out of participants, the 0.786 is where that would show first. XRP has not touched the level since late August. A daily close above it would support that reading, and the lower rail gives buyers a second line if the first breaks intraday.
The case against calling a low
The slowdown rests partly on a candle that is still open, and a late push could turn its small body into a large one. An RSI near 30 measures how far price has fallen; in a seven-week downtrend it can stay depressed while price grinds along the lower rail. The 50-day SMA is also still falling toward a rising 100-day, with the gap down to under six cents from more than seven on November 5. A cross would undo the crossover that lifted the 50-day above the 100-day around the start of September — the kind of crossover chartists track as a trend signal.
Two paths from the $1.14-$1.17 zone
If the 0.786 holds on a closing basis, a dip under today's $1.15 low to the 0.786 near $1.14, possibly with RSI briefly under 30, could attract buyers. A daily close back above $1.14 could open the way to $1.20, about 3% above the current price. A broader trend change would need a reclaim of the $1.25-$1.27 cluster, followed by the 100-day near $1.31.
If daily closes slip under $1.14, a close below the 0.786 on rising volume — the confirmation traders look for when a level gives way — would leave the lower rail near $1.11 as the last line inside the channel. Losing the rail could expose $1.05 and then the 1.0 Fib near $0.99 at the August base, 14-15% below today's price.
The November 8 and 9 closes are the first read on which path is in play, since daily closes are the standard test traders use to confirm whether a level has held. Bitcoin matters too: a fresh leg lower there could still carry XRP through these levels, whatever its own chart shows.

