XRP Rally at a Crossroads: Ali's $2.10 Setup, Brandt's Weekly Chart and Record Binance Flows
Key Takeaways
- •XRP traded near $1.52 according to CoinMarketCap data at the time of writing, leaving open whether its sharp rebound can develop into a sustained uptrend.
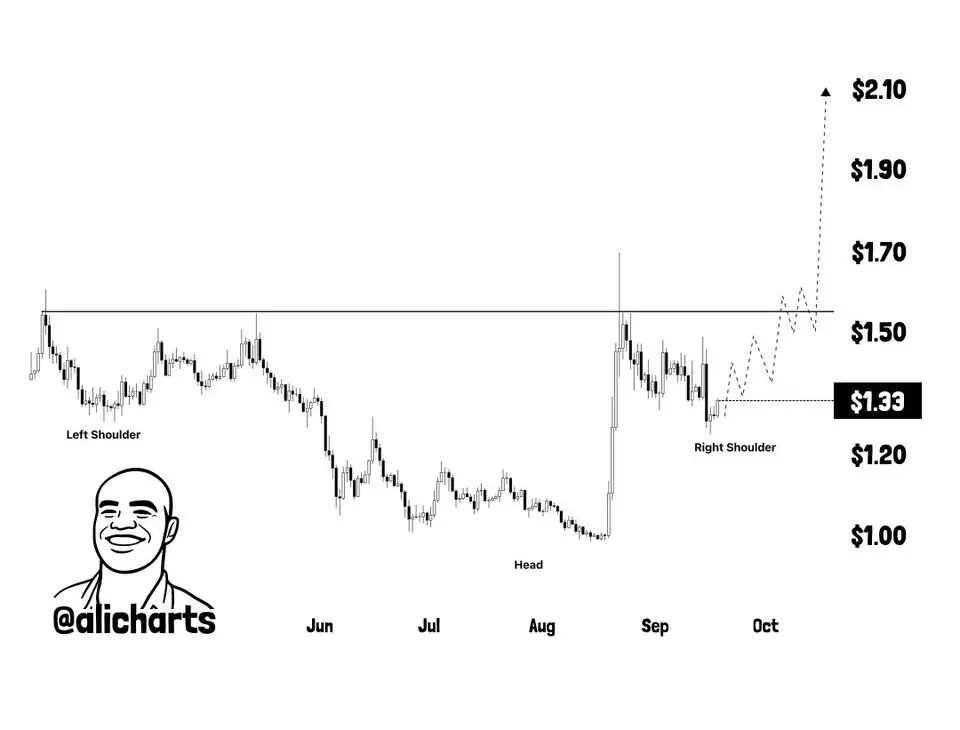
- •Ali Charts' daily inverse head-and-shoulders setup carries a $2.10 measured target that becomes relevant only after XRP posts daily closes and follow-through above the pattern's neckline.
- •Peter Brandt's September 27 weekly logarithmic chart places the recovery inside a broader post-peak structure and labels a possible head-and-shoulders sequence without offering a fresh price target.
- •CryptoQuant recorded extreme inflows and outflows, increased derivatives positioning and a higher long-term reserve trend on Binance after XRP closed at a six-month high of $1.572 on September 22.
- •CryptoQuant's author argued that price highs combined with record two-way flows and elevated leverage have more often preceded consolidation than continuation, making confirmation dependent on XRP holding key daily and weekly levels.
XRP, the native token of the XRP Ledger, traded near $1.52 at the time of writing, according to CoinMarketCap data, and the question facing the market is whether the token can convert a sharp rebound into a sustained trend. Three recent analyses approach that question from different angles: a daily chart from Ali Charts that outlines a potential inverse head-and-shoulders pattern, a weekly chart from trader Peter Brandt that places the recovery inside a far larger structure, and a CryptoQuant review of the exchange and derivatives activity that accompanied the move. None of the three presents a finished verdict; each defines conditions that price and positioning data must meet before signal can be treated as confirmed. That mix of chart structure, on-chain exchange flows and derivatives data reflects how crypto market conditions are commonly framed today: no single metric is treated as decisive on its own.
Ali's $2.10 projection needs a confirmed breakout
A daily XRP chart published by Ali Charts sketches an inverse head-and-shoulders formation. An earlier low forms the left shoulder, a deeper trough forms the head, and a later, higher low becomes the right shoulder. In classical charting, this formation is conventionally read as a potential reversal structure that follows a decline, which is why analysts typically wait for confirmation before treating it as a signal. The pattern carries technical weight only after a daily close and follow-through above its neckline.
The $2.10 level attached to the setup is a measured move, calculated by applying the height of the pattern to its breakout point. It becomes relevant only after XRP clears the neckline and continues to trade above it.
XRP was trading around that decision area at publication. Daily closes above it would show that former resistance is beginning to function as support, while a return below it would leave the pattern unresolved. An earlier Coindoo analysis covered XRP's break above its descending channel, and the narrower question now is whether the market can hold the next resistance zone after that initial breakout.
Brandt's weekly chart gives the recovery a longer history
A September 27 post by Peter Brandt, a veteran trader long associated with classical chart analysis, uses a logarithmic weekly XRP/USD chart. Each candle represents a full week, while the logarithmic scale shows percentage moves rather than equal dollar increments — a common choice for assets with multi-year trading histories, where early prices would otherwise be visually compressed on a linear scale.
The chart traces XRP's broad compression after its earlier cycle peak: a descending ceiling from the major highs and a rising floor from later lows. XRP had already moved above that wider structure before the current phase, leaving the longer-term chart very different from the daily setup alone.
At the far right, Brandt labels a possible head-and-shoulders (S-H-S) sequence around the present. The post does not include a fresh measured target or a breakout projection; it places XRP near a horizontal reference line following the earlier structural move.
The two charts are best read separately. Ali's graphic maps a short-term inverse head-and-shoulders pattern and a conditional $2.10 objective, while Brandt's weekly chart provides the wider setting in which that shorter-term attempt is taking place.
CryptoQuant's warning is about market behavior
CryptoQuant recorded unusually strong two-way XRP activity through Binance around the recent high, which followed XRP's close at a six-month high of $1.572 on September 22. Its analysis noted extreme inflows and outflows, increased derivatives positioning and a higher longer-term XRP reserve trend on the exchange. Flow metrics of this kind are produced by attributing on-chain transfers to wallets identified as exchange-controlled, and Binance's scale among crypto spot and derivatives venues is a key reason its figures draw outsized attention.
The figures show intense participation, but they do not identify the purpose of each transfer. Exchange deposits may relate to selling, trading, collateral or wallet management, while withdrawals can reflect accumulation, settlement or movements between entities. The data therefore describe the intensity of activity more clearly than its direction.
The report's author argued that a price high combined with record two-way flows and elevated leverage has more often preceded consolidation than immediate continuation. That is an analytical interpretation, not a rule that XRP must follow, but it explains why the current recovery needs to be judged alongside the activity surrounding it.
So, can XRP hold its ground?
For now, XRP is trading around the area that separates a developing breakout from a failed daily setup. That keeps the recovery case alive, but it does not yet confirm a sustained trend.
The answer depends on whether XRP can establish daily closes above Ali's neckline. Brandt's weekly view would gain credibility if XRP can improve around its horizontal reference line on weekly closes. Price holding those areas while exchange turnover and futures positioning become less extreme would give the rally a firmer base.
A move back below the daily recovery area would weaken that case quickly. Until either outcome becomes clearer, XRP is best read as a market testing support after a sharp recovery, not one that has already secured its next advance.
This article is provided for informational purposes only and does not constitute financial or investment advice. Technical patterns and market metrics are interpretive tools, not guarantees of future price movement.

