XRP Trades at $1.43 as Large Holders Accumulate 1.54 Billion Tokens
Key Takeaways
- •XRP traded at $1.43, 3.13% in 24 hours and 4.10% over seven days, with 24-hour trading volume of approximately $3.41 billion.
- •Analyst Ali Charts identified an unconfirmed inverse head-and-shoulders pattern on the daily chart, naming $1.55 as the neckline whose confirmed break could drive a 35% rally toward $2.
- •Large holders accumulated about 1.54 billion XRP, worth roughly $2.2 billion, over a 96-hour window, according to Ali Charts' on-chain analysis.
- •ChartNerd identified the $1.45-$1.51 zone, containing the 0.5 and 0.618 Fibonacci levels, as the next resistance area, with the 50-week EMA sitting at $1.51 after nearly five weeks of tight weekly compression between the 20- and 50-week moving averages.
- •Both analysts frame the $1.45-$1.55 band as the key area to watch, with decisive weekly closes above $1.51 and a confirmed break of the $1.55 neckline marking the conditions for continued upside, while rejection could return XRP to its existing range.
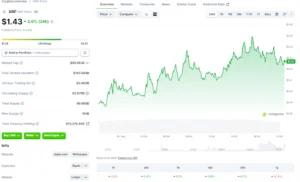
XRP was trading at $1.43 at the time of writing, according to CoinGecko market data. The token had gained 3.13% over the previous 24 hours and 4.10% over seven days, while trading volume reached $3,408,218,413 during the same 24-hour period.
Market analysts are monitoring a possible inverse head-and-shoulders pattern, a key Fibonacci zone and increased activity among large XRP holders. These developments place resistance between $1.45 and $1.55 in focus for upcoming trading sessions, and because the chart-based and on-chain signals point toward the same narrow band of levels, they provide traders with a shared set of reference points heading into those sessions.
Ali Charts Identifies Potential $2 Pattern
In a post on X, Ali Charts presented a technical analysis of XRP on the daily chart. The analyst said the token appeared to be forming the right shoulder of an inverse head-and-shoulders pattern and identified $1.55 as the neckline. The inverse head-and-shoulders is a formation that technical analysts traditionally read as a potential reversal of a preceding downtrend, with a break above the neckline serving as the conventional confirmation signal for the setup.
XRP TARGETS $2
On the daily chart, $XRP appears to be forming the right shoulder of an inverse head-and-shoulders pattern.
If the setup continues to develop, I’m watching for a move toward the neckline near $1.55.
That’s the key level.
A confirmed breakout above $1.55 could…
— Ali Charts (@alicharts) September 18, 2026
Ali Charts described $1.55 as the key level for the setup. A confirmed move above that price could validate the pattern, with the analyst projecting a 35% rally toward $2 and possibly higher.
The pattern has not yet been confirmed. Ali Charts said it must continue to develop before a move toward the neckline takes shape. At $1.43, XRP was $0.12 below the identified level. Without a breakout above $1.55, the formation remains unconfirmed.
Large Holders Accumulate 1.54 Billion XRP
Ali Charts separately reported increased whale activity on the XRP network over the previous 96 hours. Large holders appeared to have accumulated approximately 1.54 billion XRP, valued at around $2.2 billion. Large-holder accumulation is a widely followed on-chain metric because it captures shifts in the holdings of a network's biggest wallets, although the data alone does not reveal the intent behind the transfers.
The analyst described the activity as a significant accumulation spike and said it could soon translate into price action and a bullish breakout.
$2 BILLION IN XRP BOUGHT BY WHALES
Whale activity on the XRP network has surged over the past 96 hours.
Large holders appear to have accumulated roughly 1.54 billion $XRP , worth around $2.2 billion.
That’s a significant accumulation spike that could soon translate into price…
— Ali Charts (@alicharts) September 19, 2026
The two Ali Charts posts address separate elements of the same potential breakout. The first focuses on the daily-chart pattern, while the second concerns large-holder buying. The accumulation data covers 96 hours, whereas the inverse head-and-shoulders pattern is based on the daily chart.
XRP Approaches Fibonacci Resistance
Analyst ChartNerd offered a separate technical view based on Fibonacci levels. According to ChartNerd, XRP was breaking out of a descending resistance structure and moving through the 0.382 Fibonacci level. Fibonacci retracement levels, which are derived from ratios of the Fibonacci sequence, are a standard tool in technical analysis for marking potential support and resistance zones.
The next resistance area was identified between $1.45 and $1.51, where the 0.5 and 0.618 Fibonacci levels are located. ChartNerd said these zones have historically served as important decision points. With XRP at $1.43, the token was just below the lower end of that range.
ChartNerd added that the current structure favored continuation, while emphasizing that confirmation remained important. The weekly chart also showed nearly five weeks of tight compression between the 20- and 50-week moving averages. The 50-week exponential moving average, or EMA, was positioned at $1.51 and represented another critical dynamic level.
ChartNerd said the setup was coiling for a potentially sharp expansion. Decisive weekly closes above $1.51 would support additional upside momentum, while rejection at the Fibonacci levels could return XRP to its existing range. Read alongside Ali Charts' levels, the two analyses frame the $1.45–$1.55 band as the key area to watch, with decisive weekly closes above $1.51 and a confirmed break of the $1.55 neckline marking the conditions each analyst set for continued upside.
Source: Blockonomi

