XRP Extends Losses as Negative Funding and Rising Yields Weigh on Sentiment
Key Takeaways
- •XRP traded around $1.422 on Thursday, extending its weekly decline to more than 6% after three consecutive losing sessions.
- •XRP's perpetual futures funding rate fell to -0.0022% and the long-to-short ratio stood at 0.88, signaling a tilt toward bearish derivatives positioning.
- •A 10-year Treasury yield near 5.30%, a firm dollar around 102.24, and Fed minutes pointing to a possible further rate hike this year weighed on speculative assets like XRP.
- •The Pentagon reportedly instructed U.S. Central Command to complete preparations for potential renewed military operations against Iran, adding geopolitical uncertainty that could reduce cryptocurrency appetite.
- •XRP's immediate support lies at the 50-day EMA near $1.400 and the 200-day EMA at $1.389, with resistance placed at $1.671 and $1.900 beyond it.
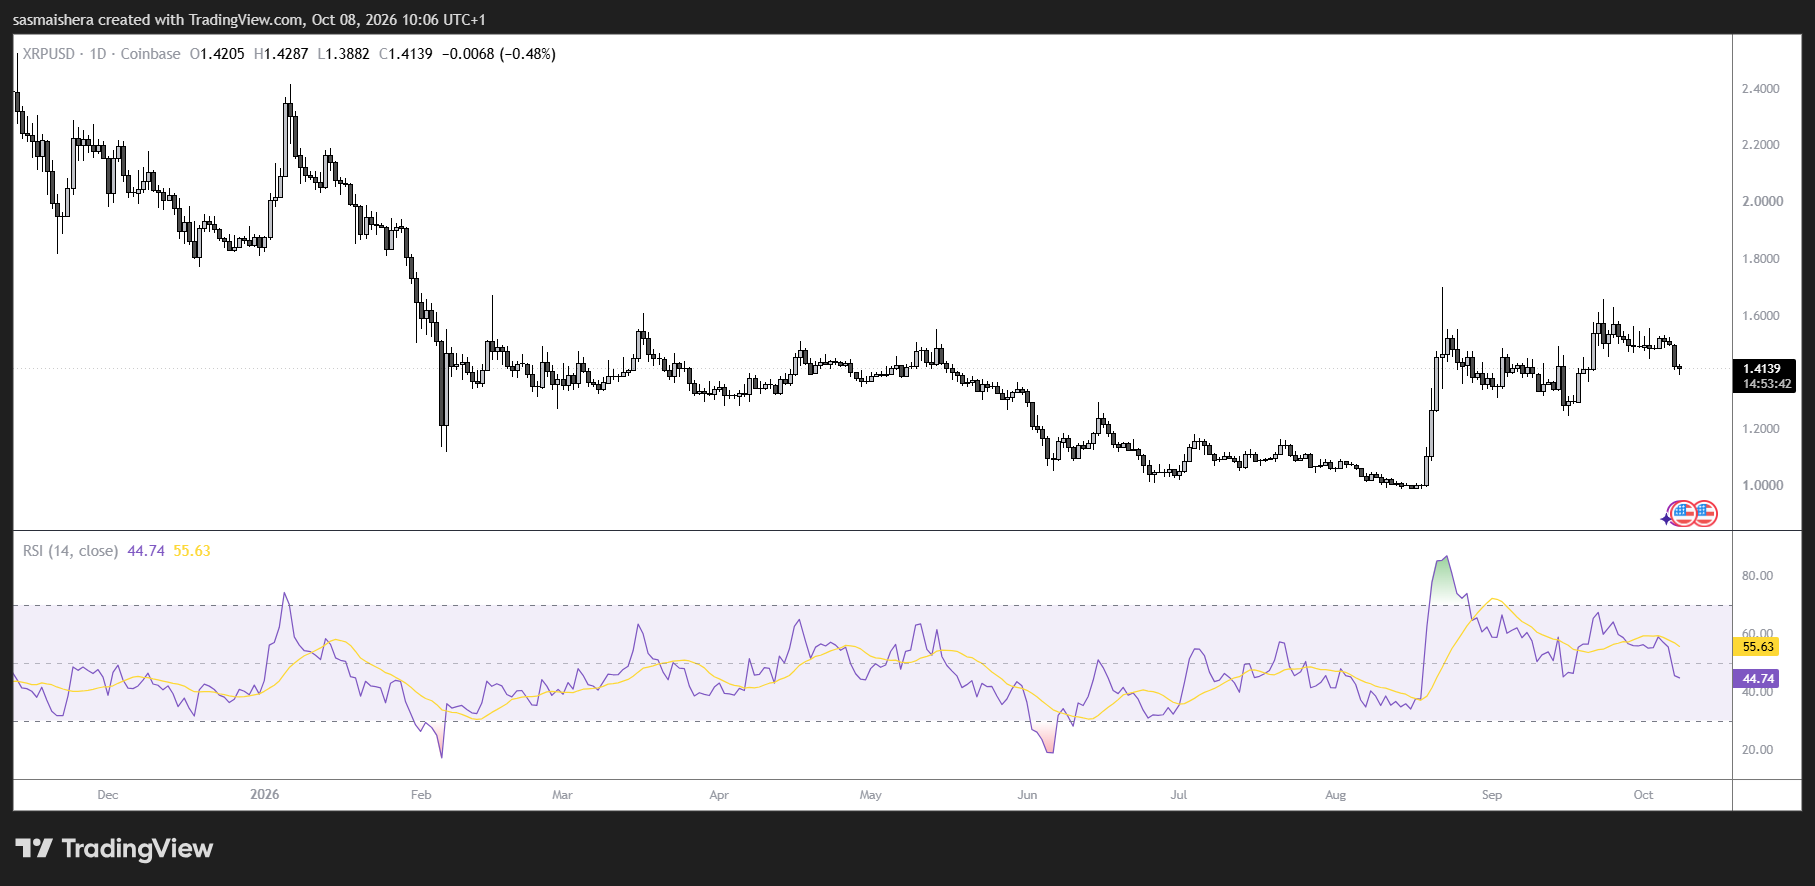
XRP remained under pressure on Thursday, extending a correction that has followed three consecutive losing sessions. The token traded around $1.422, taking its weekly decline to more than 6%, as weaker derivatives signals and a difficult macroeconomic environment limited buying interest, according to a CoinJournal report.
Negative funding rates in perpetual futures—contracts without expiry dates that crypto traders use to speculate on price direction—pointed to bearish pressure, while elevated U.S. Treasury yields, a strong dollar, and geopolitical concerns weighed on broader sentiment.
Derivatives Positioning Offers Mixed Signals
Data from CoinGlass placed XRP's long-to-short ratio at 0.88 on Thursday, indicating a slight tilt toward short positioning within the tracked dataset.
Funding rates told a more consistent story. After flipping below zero on Wednesday, XRP's funding rate stood at -0.0022% on Thursday. Negative funding means shorts pay longs and can signal demand for bearish perpetual positions. Neither funding rates nor positioning ratios, however, guarantee the direction of the next price move.
Yields and the Dollar Compound Macro Pressure
The U.S. Dollar Index stabilized around 102.24 on Thursday after touching an intraday high of 102.53 on Monday, its strongest level since early April 2025, according to the report. The U.S. 10-year Treasury yield held near 5.30% after reaching approximately 5.35% on Monday, a level described as a fresh two-decade high.
Higher yields increase the appeal of interest-bearing investments and can make conditions less supportive for speculative assets such as XRP and Stellar's XLM.
Minutes from the Federal Open Market Committee's September 15–16 meeting showed unanimous support for raising the federal funds rate target range, while most officials expected another increase would likely be appropriate before year-end to address persistent inflation. That outlook reinforced the pressure stemming from elevated yields and a firm dollar, leaving upcoming Fed communications and the path of yields and the dollar as focal points for digital-asset markets in the sessions ahead.
Reported Strike Preparations Add Geopolitical Uncertainty
The report also cited preparations for potential renewed U.S. military operations against Iran. The Pentagon reportedly instructed U.S. Central Command to complete preparations while President Donald Trump weighed the timing of possible strikes.
The accounts describe potential action rather than a confirmed attack. Nevertheless, uncertainty surrounding a potential escalation could encourage defensive positioning, support demand for the dollar, and reduce appetite for cryptocurrencies. Official statements on the matter therefore stand as a key watch item for traders.
$1.400 Support Faces a Test
Despite its weekly decline, XRP remained above its key daily exponential moving averages—trend-following indicators that give greater weight to recent prices. The 50-day EMA near $1.400 provides immediate support, followed closely by the 200-day EMA at $1.389, with the 100-day EMA standing at $1.336 below that cluster. Holding these levels would preserve part of XRP's constructive technical structure.
Momentum, however, remained weak: the relative strength index hovered near 45, below the 50 midpoint commonly used to separate stronger momentum from weaker, while the MACD, another widely used momentum gauge, sat below zero. A sustained break beneath the nearby moving-average support would bring $1.336 and horizontal support at $1.300 into focus, with $1.000 identified as a more distant downside reference.
On the upside, the analysis places notable resistance at $1.671. A sustained break above that barrier would bring $1.900 into view.

