XRP Breaks Below $1 for First Time Since August as ETF Outflows Mount
Key Takeaways
- •XRP slipped to an intraday low of $0.9967 on Nov. 13, its first trade below $1 since August, before rebounding to trade near $1.01 as volume rose 26% to $2.46 billion.
- •The decline came during a market-wide selloff in which Bitcoin fell 6.7% to about $68,800 and crypto liquidations reached $727 million over 24 hours on Nov. 12, following a 6.5% year-over-year rise in U.S. producer prices.
- •XRP exchange balances climbed by 335.76 million coins over three months, and U.S. spot XRP ETFs have logged no inflows since Oct. 29, posting $18.57 million in outflows so far in November.
- •Analyst Ali Charts said XRP's failure to clear the $1.55 channel top drove a reversal to the $0.99 channel floor, and losing that support could extend the correction toward $0.80, while a move above the 200-day EMA at $1.36 is needed to confirm a bullish trend.
- •On-chain analytics firm Santiment reported that wallets holding at least 10,000 XRP have been adding to their balances, and continued accumulation could help $1 hold and lift the price toward $1.15.
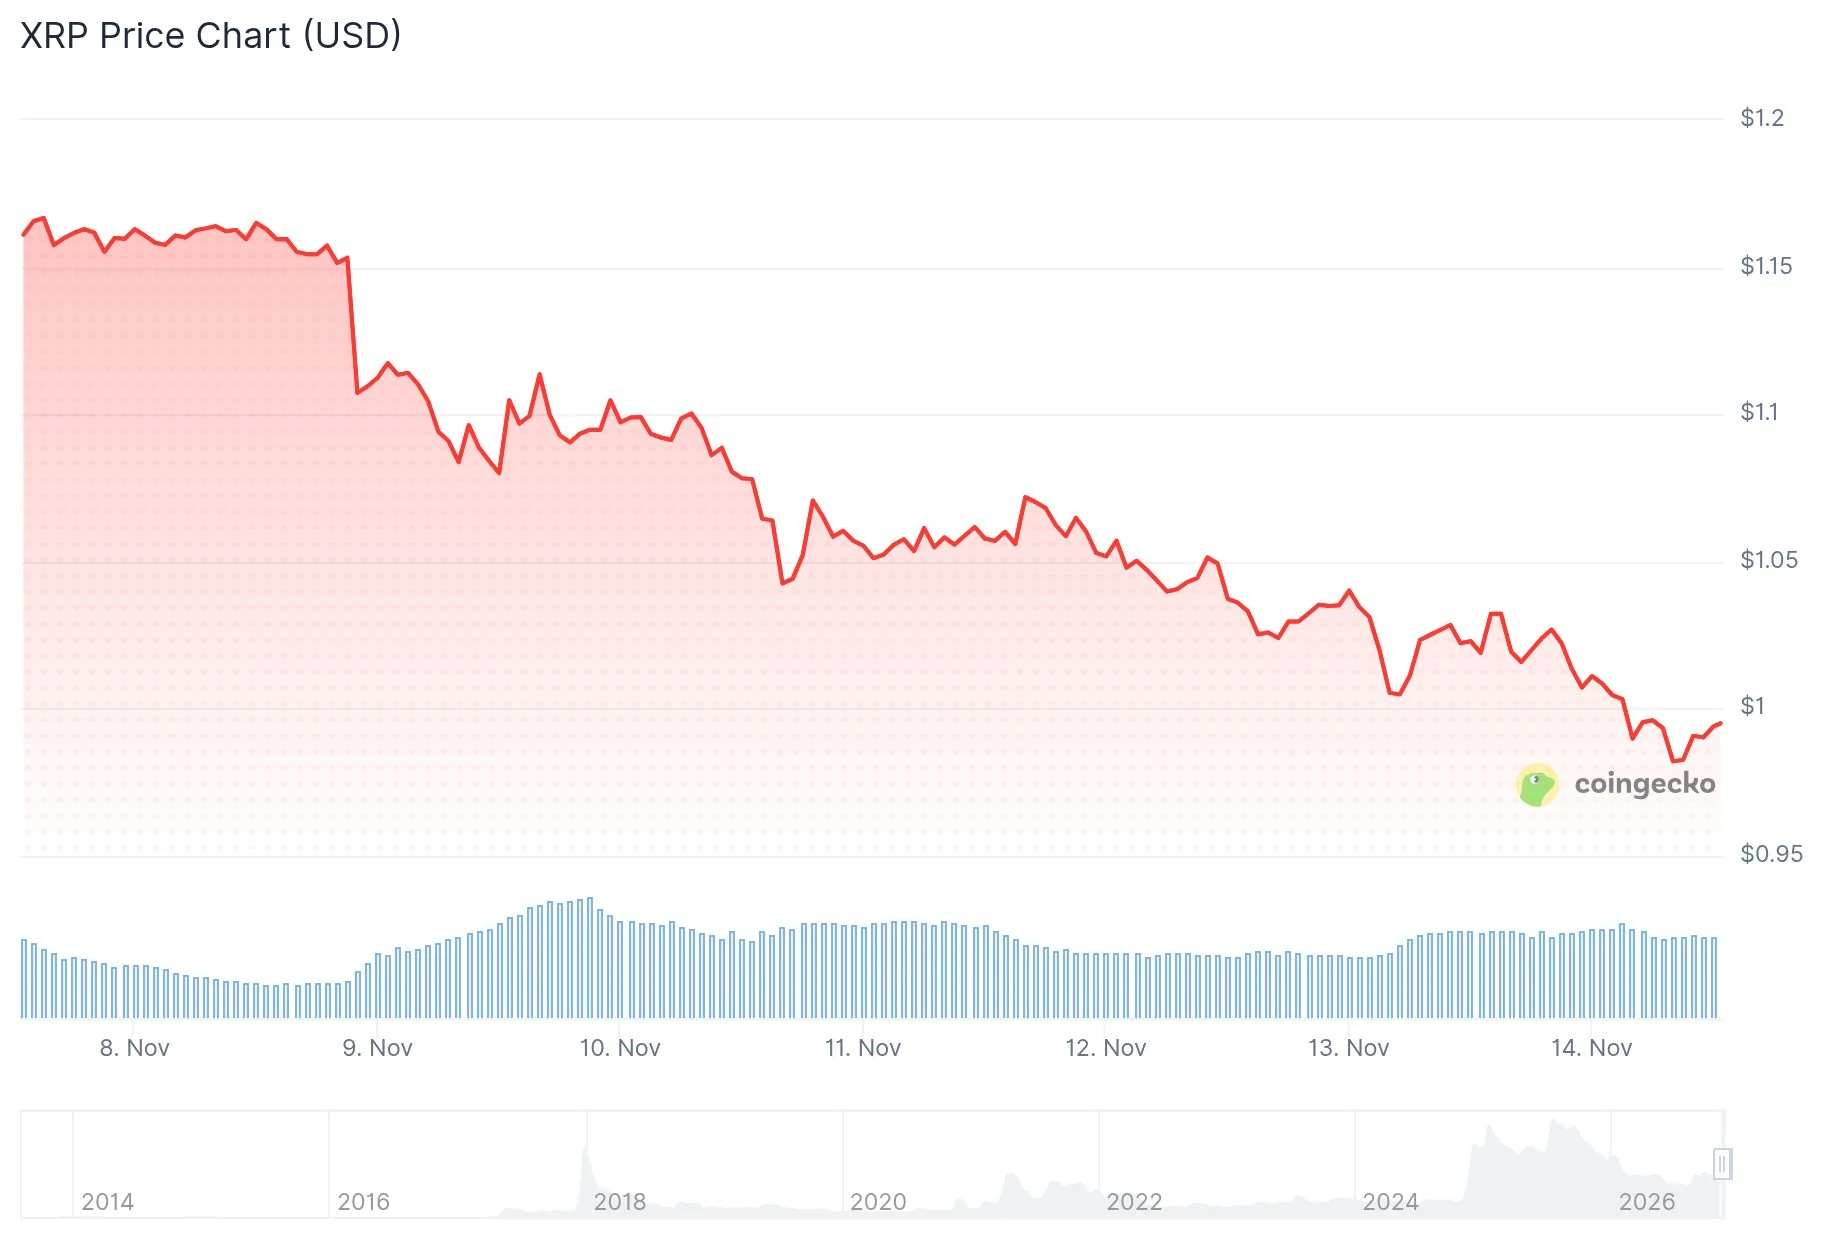
XRP slipped below $1 on Friday, Nov. 13, touching an intraday low of $0.9967 in its first trade under that level since August. The token had held above the mark for roughly three months before the break. It rebounded toward $1.02 and was trading near $1.01 at the time of writing, down 0.8% on the day, while trading volume rose 26% to $2.46 billion, according to CoinMarketCap. The jump in volume appears to reflect selling.
XRP is the native token of the XRP Ledger, where it is used to pay transaction fees. Its move under $1 came as the wider crypto market sold off. Bitcoin fell 6.7% to around $68,800, and liquidations across crypto reached $727 million over 24 hours on Nov. 12, a flush that was broad-based rather than confined to a single asset. Liquidations occur when exchanges forcibly close leveraged positions that can no longer meet margin requirements, so the figure points to leveraged bets being unwound across the market. Inflation data added to the pressure on risk assets: U.S. producer prices rose 6.5% from a year earlier in the latest Producer Price Index (PPI) report, and fears of a rate hike have followed, since higher borrowing costs tend to weigh on appetite for riskier assets.
The test of the $1 area — the first in three months — drew attention from market watchers. Trader ChartNerd shared an XRP chart on X with a short question: what if it is this simple?
What if it's this simple? $XRP 🤷♂️ pic.twitter.com/Yb7BLctFew
— 🇬🇧 ChartNerd 📊 (@ChartNerdTA) November 14, 2026
Exchange Balances and ETF Flows Show Cooling Demand
Exchange balances for XRP rose by 335.76 million coins over three months, based on CoinGlass data. Most of the increase came in October, the same month that saw a sharp drop in both XRP and the broader market. Coins parked on exchanges are viewed as readily sellable supply, so rising balances are typically read as added selling pressure.
Spot-market flows tell a similar story. XRP has recorded only 14 days of spot inflows since Oct. 1; on every other day, sellers held the upper hand. A drop in exchange balances would be needed to ease that pressure.
U.S. spot XRP ETFs have not logged an inflow since Oct. 29, according to SoSoValue — not a single session has seen net new money since then. The products have posted $18.57 million in outflows so far in November, and if that pace holds, the month could become the weakest for the funds since launch. About $18 million left U.S. spot XRP ETFs over the last two sessions. Issuers may be selling to settle redemptions, and retail buyers also tend to pull back when institutions step aside. ETF flows are widely tracked as a gauge of institutional demand, making a return to net inflows a signal many observers will be watching for as November progresses.
Santiment, an on-chain analytics firm, pointed to a different trend in an X post: wallets holding at least 10,000 XRP have been adding to their balances. If that accumulation continues, $1 could hold and the price could move toward $1.15.
Key XRP Price Levels Traders Are Watching
Analyst Ali Charts said XRP failed to break above $1.55, the top of its price channel, and the inability to clear that level set up a full reversal to the channel's lower boundary at $0.99, erasing the token's recent gains. That series of calls has tracked the token's slide from the channel top toward its lower boundary.
XRP REVERSES ALL GAINS
It happened. $XRP failed to break above the $1.55 resistance at the top of the channel and has now completed a full reversal toward the channel’s lower boundary at $0.99.
Now, $0.99 must hold.
If XRP loses this support, the correction could extend… pic.twitter.com/hf3DPgaS9m
— Ali Charts (@alicharts) November 13, 2026
"Now, $0.99 must hold," the analyst wrote. He said a loss of that support could extend the correction toward $0.80, a level about 19% below $0.99.
The same call has been building for days. Earlier this month, Ali Charts said XRP had lost the channel's mid-range support. On Nov. 9, he eyed a climb toward $1.30 if $1.14 held, but that level has since given way.
Momentum indicators lean the same way. The relative strength index (RSI) reads 37, showing momentum favoring sellers, and the line is also printing lower lows. Readings under 50 typically point to bearish momentum dominance. Below $1, the next test sits at $0.98, with $0.65 as a deeper level if selling continues. A move above the 200-day exponential moving average (EMA) at $1.36 would be needed to confirm a bullish trend; traders often use the 200-day EMA as a long-term trend filter.
Market sentiment has also shifted to extreme fear, leaving many buyers on the sidelines.
Traders are now watching whether XRP can close above $0.99, with upcoming daily closes offering the first signal of either direction. Failing that, the August low of $0.9852 sits just below as the next level to watch. For now, the zone between $0.9852 and $0.99 has become the market's near-term line in the sand.
Source: CoinCentral

