XRP Could Reach $12 If XRP/BTC Breakout Confirms, Analyst Says
Key Takeaways
- •Analyst Celal Kucuker projects that a confirmed breakout on the XRP/BTC chart could drive XRP above $12, representing roughly 10x outperformance against Bitcoin from current levels.
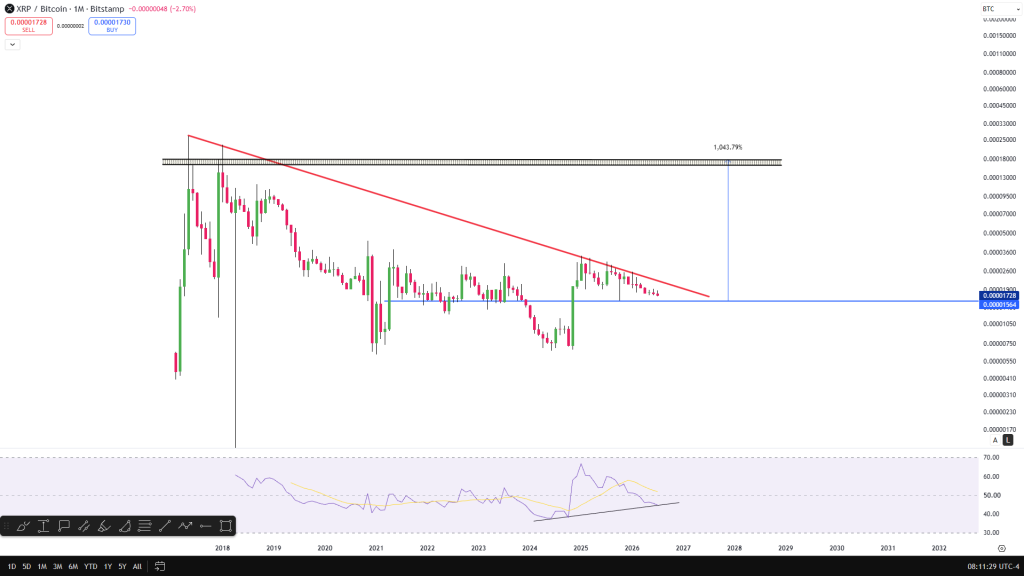
- •The XRP/BTC monthly chart shows a multi-year compression pattern nearing its apex, with key support at approximately 0.0000155 BTC holding firm despite repeated tests since 2018.
- •The SEC's ongoing appeal of key rulings in the Ripple case has prolonged regulatory uncertainty, contributing to XRP's structural underperformance relative to Bitcoin over several years.
- •The proposed Clarity Act aims to establish a clear regulatory framework distinguishing digital commodities from securities, which could remove a major barrier to XRP's institutional adoption.
- •In a best-case scenario involving regulatory clarity and robust market conditions, realistic XRP price targets range from $6 to $12, with $20 requiring extraordinary global financial integration.
XRP declined 2.5% during the ongoing market correction and is currently trading around $1.10. The broader cryptocurrency market is in negative territory, with Bitcoin holding near $65,000 and altcoins relinquishing some of their recent gains.
Analyst Celal Kucuker has weighed in on the XRP/BTC chart, pointing to a potential breakout that could send XRP above $12. Kucuker shared his analysis on X (Twitter), where he regularly publishes XRP price analysis.
XRP's price action against Bitcoin cannot be separated from its regulatory trajectory. The U.S. Securities and Exchange Commission's case against Ripple — which yielded a 2023 ruling that programmatic XRP sales on exchanges did not constitute securities offerings — remains a defining overhang on the token's relative performance. The SEC's subsequent appeal of key rulings has prolonged uncertainty, contributing to the structural underperformance visible on the XRP/BTC chart since 2018.
The XRP/BTC Thesis: 10x Outperformance Against Bitcoin
Kucuker believes the XRP/BTC chart is approaching a critical juncture. The descending channel that has contained XRP's performance against Bitcoin for years is nearing a breakout point.
If that breakout materializes, he expects XRP to outperform Bitcoin by 10x from current levels. By the time Bitcoin prints a new all-time high, XRP could already be trading above $12, according to his analysis.
The XRP/BTC pair has been in a structural downtrend since its 2018 peak. A move above the descending resistance would signal that XRP is gaining strength relative to the largest cryptocurrency by market capitalization.
XRP Chart Analysis: A Multi-Year Compression
The monthly XRP/BTC chart reveals a descending resistance trendline connecting major highs, horizontal support around 0.0000155 BTC, and major resistance around 0.000017–0.000018 BTC. This configuration forms a large descending triangle or compression pattern.
Price is currently at major support. XRP/BTC has returned multiple times to approximately 0.000015–0.000016 BTC, and buyers continue to defend that level. Sellers have struggled to establish new lows, with buyers consistently appearing at this zone. Repeated support tests increase the probability of either a strong bounce or an eventual breakdown if buyers become exhausted. At present, the support level remains intact.
Descending resistance has rejected every rally since 2018. Each rally has produced lower highs, diminished momentum, and declining volatility, confirming that the macro bearish trend has not yet been broken. Until price closes above the descending trendline on the monthly timeframe, XRP remains in a state of underperformance relative to BTC.
RSI analysis indicates that momentum has cooled, though long-term bullish momentum has not fully disappeared. RSI made a major low in 2024, recovered sharply above 60, and is now drifting back toward 45–50 with a slight rising trendline beneath it. If RSI breaks below that rising support, relative weakness against BTC would likely persist. Conversely, if RSI bounces near the 45–50 range, it could support another attempt at breaking the downtrend.
The compression pattern is approaching its apex, typically signaling that volatility is contracting and a large directional move becomes increasingly probable. A breakout could occur in either direction, but as price converges toward the apex, the space for continued sideways movement diminishes.
The upside target of approximately 0.000017 BTC represents roughly a 1,040% move from current levels. That region corresponds to previous major resistance, a former distribution zone, and an area of historical liquidity, making it a logical long-term objective following a confirmed breakout.
Bullish and Bearish Scenarios
Based on the XRP/BTC chart structure, the bullish scenario involves holding the 0.0000155 BTC support, breaking the descending trendline, retesting it as support, and then accelerating toward 0.00003 BTC, 0.00005 BTC, 0.00008 BTC, and eventually 0.000017 BTC. The key confirmation signal would be a monthly close above the descending trendline, ideally accompanied by increasing volume.
In the bearish scenario, if support fails below approximately 0.000015 BTC, there is relatively little historical support until significantly lower levels. Such a breakdown could lead to another extended period of XRP underperforming Bitcoin, consistent with the bearish implications of descending triangles when they break to the downside.
Can XRP Price Really Reach $12?
XRP could reach $12 in the next bull cycle, though this would require a substantial rally not only for altcoins broadly but specifically for XRP. A move to $12 would represent nearly a 4x increase from XRP's all-time high of approximately $3.84. While not impossible — XRP has produced comparable moves historically — it would demand a level of adoption and capital inflows that have not yet materialized.
The Clarity Act, referenced in market commentary as a potential catalyst, is proposed U.S. legislation that aims to establish a clear regulatory framework distinguishing digital commodities from digital securities. For XRP, whose institutional adoption has been constrained by the ongoing SEC litigation, a legislative resolution could remove one of the primary barriers to capital formation reflected in the multi-year downtrend against Bitcoin.
Setting aside the $12 target, the XRP/BTC chart presents a technically clean setup. The support level has held for years, the compression is reaching its apex, and RSI is showing early signs of bullish momentum. The critical factor remains a confirmed breakout above the descending trendline. If confirmed, the subsequent move could be significant. The $12 target is ambitious but mathematically feasible.
Frequently Asked Questions
Bitcoin vs. XRP as portfolio holdings: Bitcoin is the more established asset with institutional adoption and a capped supply, positioning it as a core portfolio holding. XRP offers higher potential upside if the Clarity Act passes and institutional adoption accelerates, but carries significantly more risk and volatility.
Could XRP reach $100? Mathematically possible but extremely unlikely — $100 would require a market capitalization exceeding $5 trillion, surpassing Bitcoin's current all-time high market cap, and would demand a level of global adoption unseen in the cryptocurrency sector. A more realistic long-term target would be $10–$20 in a strong bull cycle.
Realistic XRP price targets: In a best-case scenario involving passage of the Clarity Act, accelerating institutional adoption, and a robust crypto bull market, XRP could realistically reach $6–$12 within the next cycle, with $6 as the first major technical target and $10–$12 as an ambitious but plausible extension. Beyond that, $20 would require an extraordinary level of global financial integration.

