XRP Falls Out of Its Descending Channel, $0.99 Four Cents Away
Key Takeaways
- •XRP dropped 4.68% to $1.05 on Binance, hitting a low of $1.03, after breaking below both the 0.786 Fibonacci retracement near $1.14 and the descending channel's lower rail that had held during six weeks of selling.
- •Tuesday's rebound to $1.11 was rejected at the underside of the broken channel rail, making the $1.08 to $1.11 band the first resistance XRP must reclaim to move past the breakdown.
- •The 14-day RSI fell to 23.13, its lowest reading since July and nearly seven points below the oversold threshold of 30, while the price sits 17.2% beneath the 200-day SMA at $1.27.
- •The next daily close near the $0.99 to $1.00 August low will determine whether a relief move back to $1.08-$1.11 develops or the August-to-September rally is fully retraced, with $0.90 to $0.95 as the next support zone.
- •The selloff coincided with a broader market decline after the October inflation report, and a further fall in Bitcoin below $74,000 could push XRP through $0.99 regardless of its stretched RSI.
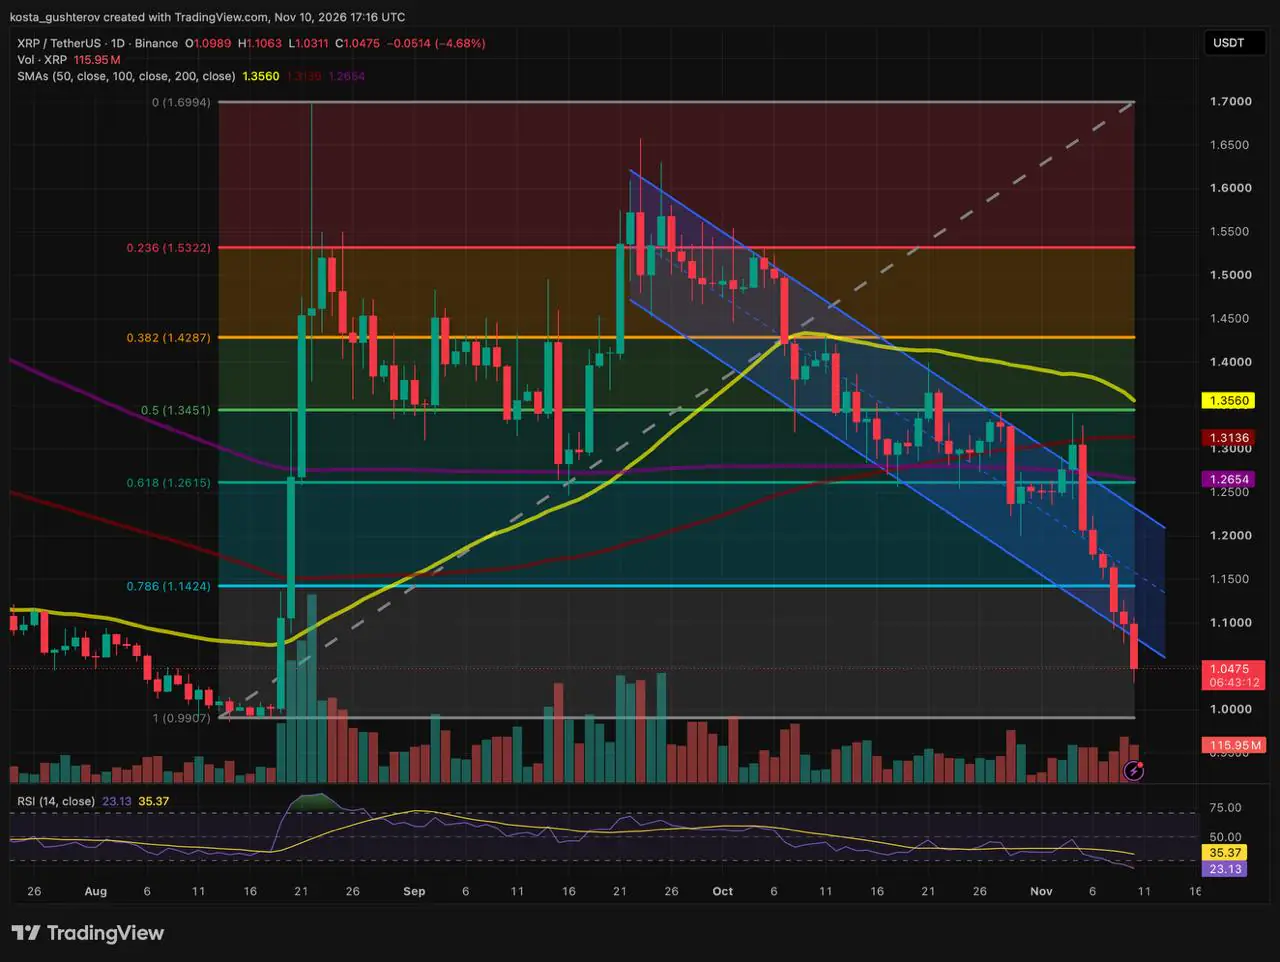
XRP is trading at $1.05 on the Binance daily chart as of 17:16 UTC, down 4.68% on the day after touching a low of $1.03. A single session carried the token through two previously defended lines: the 0.786 Fibonacci retracement near $1.14 and the lower rail of the descending channel that had contained every sell-off for the past six weeks.
The sequence had been laid out in advance. Coindoo's November 8 analysis set the order: a daily close under the 0.786 near $1.14 would leave the lower channel rail near $1.11 as the last line of defense, and losing that level could expose $1.05 and then $0.99. The $0.99 line, where the rally began, is now within four cents of the current price. The daily relative strength index (RSI) stands at 23.13, its lowest reading since July, and price sits 17.2% below the 200-day simple moving average (SMA).
Two sessions, two floors
The weekend pause near $1.16 did not hold. Monday's candle went through the 0.786 near $1.14 and kept going, exiting through the bottom of the blue channel that had absorbed every sell-off for six weeks.
Tuesday demonstrated what the broken line now means. XRP opened at $1.10, lifted to $1.11 — precisely where the underside of the broken rail sits — and was sold straight back down. The day's low came in at $1.03 before price steadied around $1.05 at the time of writing.
Falling out of a falling channel
This break differs in kind from the one on November 5. On that occasion, XRP failed above the channel and fell back inside it. This time, it has left through the floor, beneath a boundary that was itself sloping downward.
As the analysis notes, a drop of this kind is more often the final stretch of a sell-off than the start of a new one. The channel already carried the downtrend; falling beneath its lower rail means selling at a pace the trend did not require, and such a pace is difficult to sustain. The pattern fits forced exits rather than fresh positioning.
The flip side is that the rail now works against buyers. For six weeks, it was where dips were bought. Tuesday's rejection at $1.11 shows sellers using it from above, meaning the $1.08 to $1.11 band is the first obstacle XRP would need to reclaim to put the breakdown behind it.
RSI at 23.13, the lowest on the chart
The 14-day relative strength index reads 23.13, nearly seven points below the 30 level that signals oversold conditions and 12.24 points under its signal line at 35.37. Nothing on the daily chart from late July through November comes close: not the September reversal, not the late-October sweep, and not the November 5 rejection.
Two days ago, the same indicator sat at 31.41, with the gap to its signal line under seven points; both figures have since moved further against buyers. A reading this far below its own average measures how one-sided the four sessions of selling have been, but it does not by itself mark a low.
A fifth of the way below the 200-day
All three daily moving averages are rolling over far above price. The 50-day SMA sits at $1.36, the 100-day at $1.31, and the 200-day at $1.27. XRP trades $0.22 below the 200-day — the longest of the three and a widely followed gauge of the long-term trend — a gap of 17.2%.
The further price sits from its long-term average, the more room a mean-reversion bounce has when one arrives. Coindoo's view is that the odds of such a bounce might improve once the $0.99 to $1.03 zone has been properly tested, not before.
The ladder from $1.70 to $0.90
The rungs below are Fibonacci retracement levels of the August-to-September rally — the standard ratios technical analysts use to gauge how much of a prior move has been given back.
Overhead:
- Near $1.70: 0 Fib at the September peak
- Near $1.53: 0.236 Fib
- Near $1.43: 0.382 Fib
- Near $1.35 to $1.36: 0.5 Fib and the 50-day SMA
- $1.31: 100-day SMA, which capped the early-November rebound
- Near $1.26 to $1.27: 0.618 Fib and the 200-day SMA
- Near $1.14: 0.786 Fib, now meeting the upper channel rail
- $1.08 to $1.11: broken lower rail and Tuesday's high
Here:
- $1.03 to $1.05: Tuesday's low and the current price
Below:
- Near $0.99 to $1.00: 1.0 Fib at the August low and the round number
- $0.90 to $0.95: early-August consolidation lows
Sweep and snap back, or straight through
XRP's next daily close could decide whether support near $0.99 produces a rebound or gives way to further losses.
If $0.99 holds: Sellers would push XRP under Tuesday's $1.03 low to test $1.00 and the 1.0 Fib near $0.99, about 5.4% beneath the current price, where buyers defending the August breakout level would meet an RSI already at 23.13. A hold anywhere in the $0.99 to $1.03 zone could set up a relief move back to the broken rail at $1.08 to $1.11, roughly 5.6% above today's close. Only a close back above that band would put XRP inside the channel again and open a test of the 0.786 near $1.14, about 9% higher.
If $0.99 breaks: A bounce that stalls below $1.08 to $1.11, followed by a daily close under the 1.0 Fib near $0.99, would complete a full retracement of the August-to-September rally, leaving none of the structure that rally built.
Tuesday's leg lower came with the broader market after the October inflation report, the same release that preceded Bitcoin's dip under $74,000. XRP's test of its August base is its own, but the timing of the next move may not be: a further fall in Bitcoin could carry XRP through $0.99 regardless of how stretched its RSI is.

