XRP Price Analysis: $1.05 Support Level in Focus as Technical Indicators Send Mixed Signals
Key Takeaways
- •XRP is trading at $1.08, approximately 21% below its 200-day moving average of $1.37, with the 7-day, 20-day, and 50-day moving averages all forming overhead resistance.
- •Open interest surged 10.46% in 24 hours, with institutional traders 75.6% long and retail traders 72.6% long, despite a taker buy/sell ratio of 0.77 favoring sellers.
- •A July 2023 ruling by Judge Analisa Torres found that XRP was not a security in secondary market sales, a decision widely viewed as a milestone for the token and the broader digital asset industry.
- •XRP has declined approximately 70% from its all-time high of $3.65 reached last July, with some analysts identifying $0.90 as the next significant support level if the token falls below $1.
- •Motley Fool contributors have set price targets of $3.00 as a 2025 floor and $4.00 by the end of 2026, citing regulatory developments and Ripple's cross-border payment expansion as fundamental drivers.
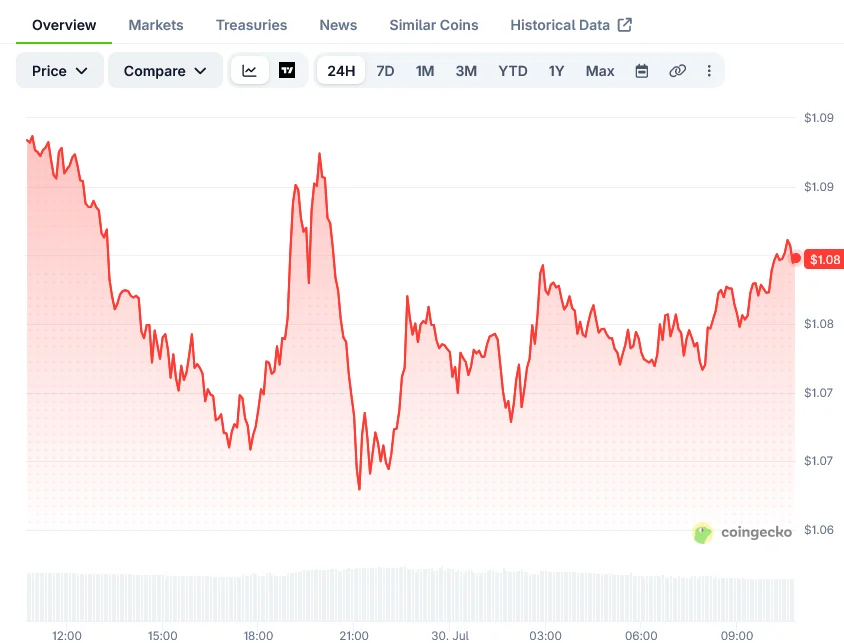
XRP is currently trading at $1.08, registering a modest decline of approximately 1% over the past 24 hours. The token now sits roughly 21% below its 200-day moving average of $1.37, as price action has compressed into an unusually narrow band.
The 24-hour trading range narrowed to just $0.03, matching the Average True Range (ATR) at the same low level. Bollinger Bands have been tightening—a pattern frequently observed before a sharp directional move. Adding to the overhead pressure, the 7-day, 20-day, and 50-day moving averages are all positioned above the current price, forming a layered wall of resistance.
Technical Indicators Point in Different Directions
The MACD has flattened with a histogram reading of zero, indicating that while the prevailing downtrend has lost momentum, buyers have not mustered sufficient strength to reverse direction. The Relative Strength Index (RSI) stands at 44—a neutral zone that is neither low enough to attract bargain hunters nor high enough to draw in momentum traders.
Stochastics, however, present a somewhat different picture. With %K at 26.67 and %D at 21.34, the oscillator is pushing into oversold territory, a condition that has historically preceded short bounces within a few trading sessions.
The Bollinger %B reading of 0.27 confirms that price is hugging the lower band. A further decline from current levels would quickly put the $1.05 support to the test—a floor that traders are monitoring closely.
Open Interest and Trader Positioning
Open interest surged 10.46% over the past 24 hours, suggesting fresh capital entering the market rather than existing positions being reshuffled. Institutional traders are 75.6% long, while retail traders are close behind at 72.6% long.
Despite this broadly bullish positioning, the taker buy/sell ratio sits at 0.77, meaning sellers are currently executing more successful trades than buyers. This divergence between positioning and near-term execution highlights the uncertainty that has characterized XRP trading in recent weeks, as participants weigh tightening technical conditions against a broader market that has lacked directional conviction.
Analyst Price Targets and Historical Context
Some analysts maintain longer-term price targets anchored to regulatory clarity and expanded use cases rather than short-term chart patterns. XRP's regulatory status has been a central question since the SEC filed suit against Ripple in December 2020, alleging the token was an unregistered security. A July 2023 ruling by Judge Analisa Torres found that XRP was not a security in the context of secondary market sales—a decision widely viewed as a milestone for the token and for the broader digital asset industry. That ruling briefly propelled XRP sharply higher before subsequent market-wide selling pressure reasserted itself.
Motley Fool contributor Dominic Basulto has set a target of $4.00 by the end of 2026, while fellow contributor Alex Carchidi has identified $3.00 as a floor target for the token this year. Ripple's ongoing expansion of cross-border payment partnerships and its push into institutional liquidity services are frequently cited by bullish analysts as fundamental drivers distinct from pure technical setups.
Looking at the bigger picture, XRP has experienced only five major bull rallies across its 12-year history, according to lifetime TradingView charts. Each rally was followed by a significant retracement. The pattern has repeated at varying price levels: when XRP climbed above $1.50, it subsequently fell below $0.50; when it surpassed $2, it dropped to $0.90; and after rising above $3 on three separate occasions, it fell back to $1.10 each time.
XRP reached an all-time high of $3.65 in July of last year. It has since declined approximately 70% from that peak, touching a low of $1.07. The token now faces the risk of dropping below the $1 mark, with some analysts identifying $0.90 as the next significant support level should that occur.
Meanwhile, Bitcoin has been range-bound between $60,000 and $65,000 for months, and the broader cryptocurrency market has not produced a strong upward move this year. With no decisive catalyst emerging across the sector, individual tokens like XRP remain largely at the mercy of internal technical dynamics and token-specific developments such as further legal proceedings or partnership announcements.

