XRP Price Risks a $0.90 Test That Could Delay Its Next Rally by Months
Key Takeaways
- •XRP has fallen below Fibonacci support levels near $1.086 and $1.091, leaving the $0.9855 level by the $1 mark as the next potential reversal zone.
- •A drop into the $0.87 to $0.90 macro support area could reset the short-term wave count and delay XRP's next major advance by months, though the bullish long-term thesis would only be challenged by a break below the October 2025 low near $0.77.
- •The RSI near 35 is forming higher lows while XRP prints lower lows, a divergence suggesting fading selling momentum that still requires chart confirmation because it cannot by itself mark a bottom.
- •CoinMarketCap's Altcoin Season Index at 39 out of 100 sits between the Bitcoin Season and Altcoin Season thresholds, indicating conditions for a broad altcoin rally have not arrived.
- •Glassnode data showed the Coinbase premium remained negative throughout Bitcoin's retreat from its September high, with the 30-day average at its deepest level since February, pointing to weak US demand as Bitcoin traded at $71,487, down 3.79%.
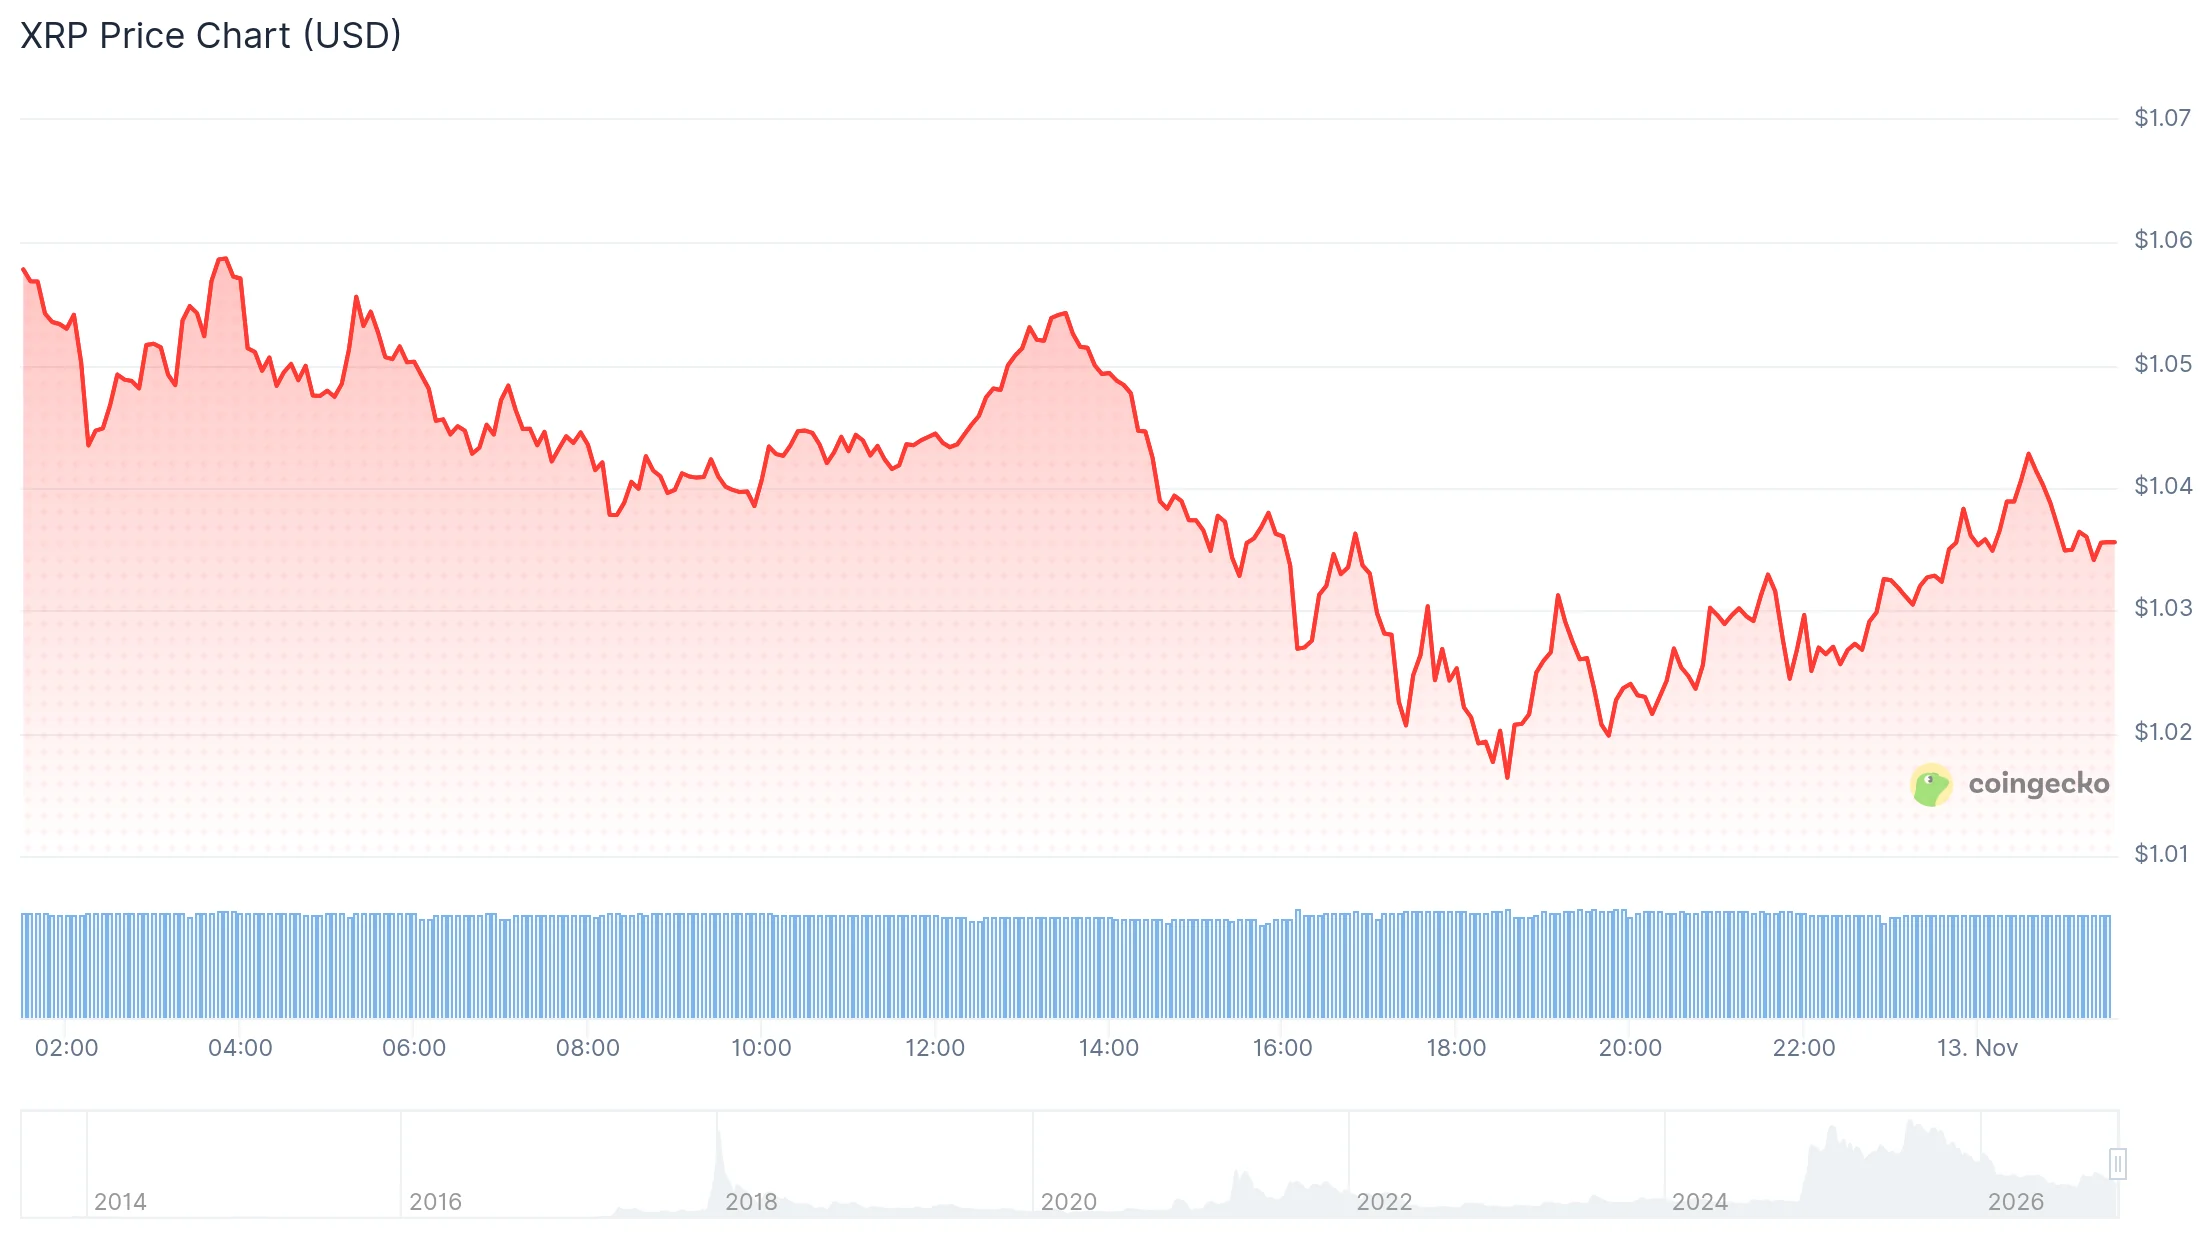
XRP is trading near the $1 level after slipping below two Fibonacci support levels, and market analyst CasiTrades warns that a further decline toward $0.90 could delay the token's next major advance by months. Her longer-term bullish outlook remains intact unless XRP breaks below its October 2025 low near $0.77, the level she treats as the line between a deeper correction and a challenge to her macro wave count.
XRP Faces a Critical Fibonacci Test Near $1
The immediate question for traders is whether buyers can defend support around one dollar. CasiTrades identifies $0.9855 — the 1.0 Fibonacci retracement — as the chart's next reversal area. Fibonacci retracements mark horizontal levels at fixed ratios of a prior price swing, and traders commonly watch them as potential reversal zones. That level also overlaps with the round-number support traders are watching, and a quick rebound from it could complete subwave 2 and preserve the current bullish structure. As a result, the $1 zone now sits between a completed correction and another leg lower.
Price has already lost a nearby support cluster formed by the 0.854 retracement near $1.086 and the 0.786 retracement near $1.091. A move back above $1.09 would reclaim that zone and improve the near-term setup. Beyond it, CasiTrades highlights approximately $1.13 and $1.25 as the next resistance levels to watch.
Bullish RSI Divergence Appears, but No Bottom Is Confirmed
Momentum data offers a tentative hint of improvement. The relative strength index (RSI), a momentum indicator that scores the pace of recent price changes on a scale from 0 to 100, sits near 35 and appears to be forming higher lows while XRP itself prints lower lows. That divergence can signal fading selling momentum, but it may persist without an immediate price rebound, and traders often wait for confirmation on the chart because RSI alone cannot mark a bottom.
The outlook remains conditional. XRP needs follow-through after any bounce from the $1 area; a single reaction would not confirm a durable reversal. Under CasiTrades' preferred reading, a double bottom forming around $1 would preserve her bullish wave count, while a fresh low near macro support would require a reset of the short-term structure.
A Drop to $0.90 Could Reset the Short-Term Wave Count
CasiTrades places macro support near $0.8688, within a broader $0.87 to $0.90 area. If XRP falls into that region and makes a fresh low, she would recast the short-term wave count — the framework that breaks a trend into impulse and correction phases to map where a market sits in a larger move. Under that scenario, another smaller Wave 1 and Wave 2 would need to form before the larger impulsive phase can begin — a process that could keep the next major advance months away.
A decline to $0.90 would therefore affect timing more than the long-term thesis. The two downside levels serve different purposes: $0.90 marks a potential structural reset for the short-term count, while the October 2025 low near $0.77 is the stated threshold that would challenge her broader macro view. The price analysis should be read as a conditional chart scenario, not a guaranteed target.
Broader Market Offers Little Confirmation for an Altcoin Rally
The warning comes as altcoins continue to lag Bitcoin. CoinMarketCap's Altcoin Season Index stood at 39 out of 100. The platform classifies readings of 25 or below as Bitcoin Season and scores of 75 or higher as Altcoin Season; the current figure sits between those thresholds, showing that altcoins have not reached the mark for a broad altcoin season.
On-chain analytics firm Glassnode also reported weak US Bitcoin demand. Data showed the Coinbase premium — the gap between Coinbase's price and global exchange prices, often used as a proxy for US buying pressure — stayed negative throughout Bitcoin's retreat from its September high, with the 30-day average reaching its deepest level since February. The firm noted that rallies in 2024 and 2025 coincided with positive premiums, though some earlier advances did begin from discounts as deep as current levels. At the time of the post, Bitcoin traded at $71,487, down 3.79%.
Near-Term Checkpoints for XRP
For XRP, the near-term checkpoints remain clear: hold the roughly $0.98 to $1 zone, then reclaim $1.09. Failure to defend one dollar leaves the $0.90 region exposed, and a lower low there would force a slower wave setup even if the longer-term structure survives another decline. The next chart update will hinge on price behavior at support and on whether the RSI trendline continues to hold.
This article was originally published on Blockonomi.

