XRP Nears $1 Support as US Spot XRP ETFs Post Weekly Outflows
Key Takeaways
- •XRP traded near $1.097 on Monday after shedding more than 10% of its value over the previous week.
- •US spot XRP ETFs recorded $529,510 in net outflows last week, reversing two consecutive weeks of inflows.
- •XRP's long-to-short ratio dropped to 0.89, its lowest in over a month, indicating short positions outnumber long positionsMarket pricing for a December Federal Reserve rate hike rose to roughly 78.7% from 72.8% after stronger-than-expected US Nonfarm Payrolls data.
- •XRP sits below its 50-, 100-, and 200-day EMAs clustered between $1.302 and $1.360, with an RSI near 26 and the $1 psychological support in focus.
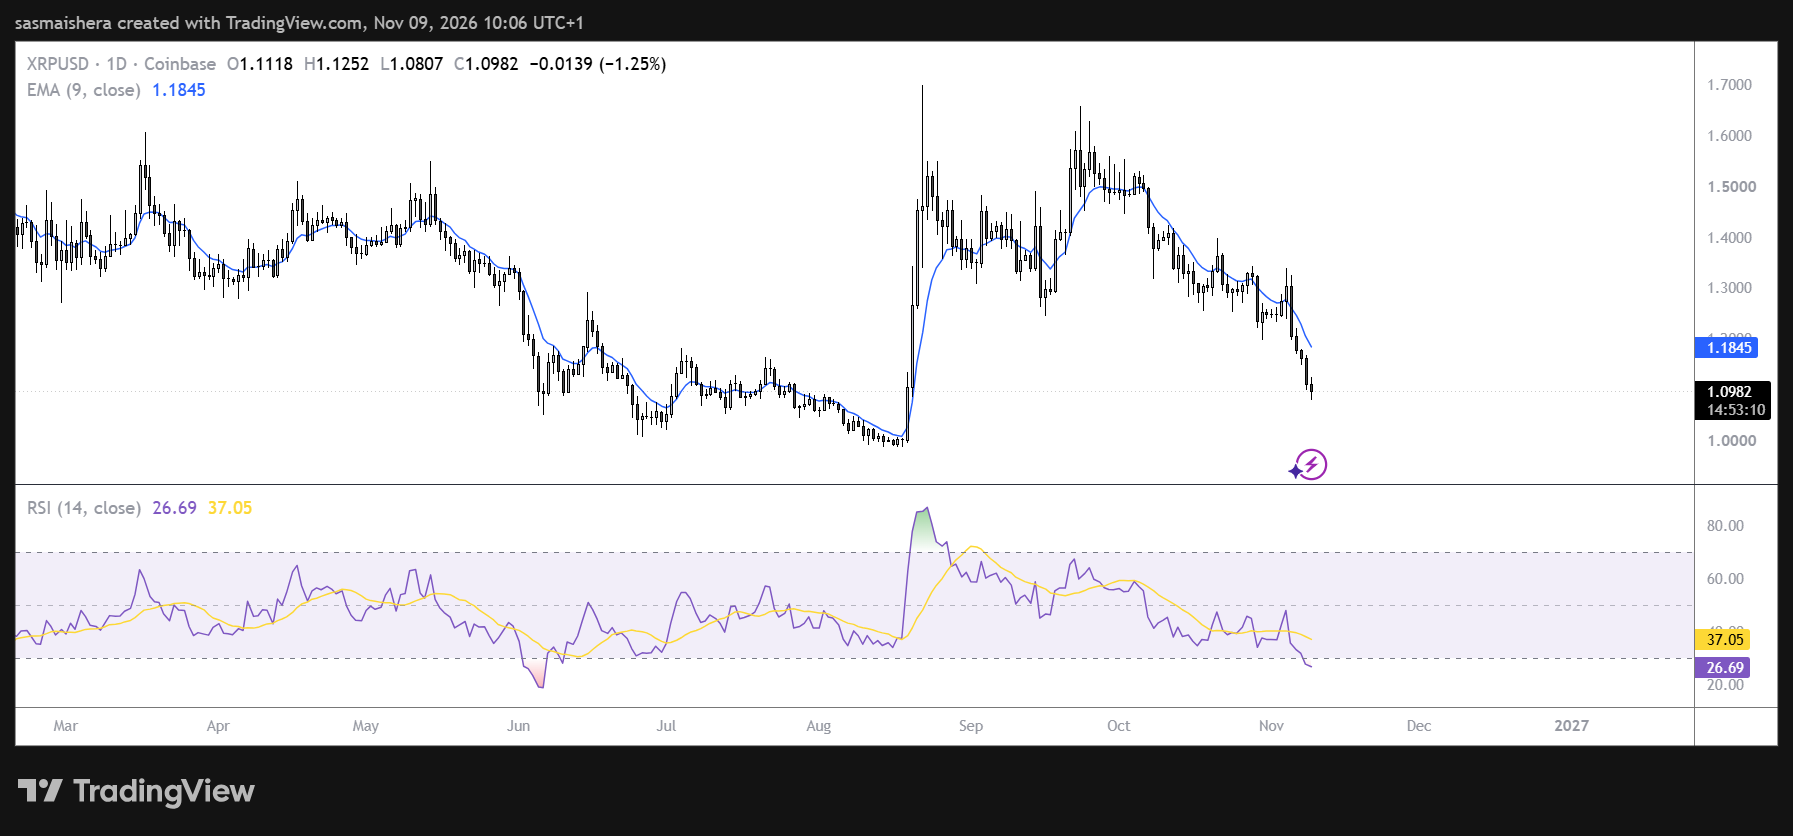
XRP continued to trade under selling pressure on Monday, changing hands near $1.097 after losing more than 10% of its value over the previous week, with sellers maintaining control of the broader market. The token remains in bearish territory as weakening institutional demand, deteriorating derivatives positioning and unfavorable macroeconomic conditions weigh on recovery attempts.
ETF Outflows Point to Cooling Institutional Demand
Institutional appetite for XRP weakened last week, reversing the positive momentum recorded during the two prior weeks. According to SoSoValue, US spot XRP ETFs recorded $529,510 in net outflows last week, ending two consecutive weeks of inflows. Because spot ETFs hold the underlying token directly, their weekly net-flow tallies are widely followed as a barometer of institutional participation in a given asset.
The return to negative weekly flows comes at a particularly vulnerable time for the asset, which was already facing substantial technical weakness. Upcoming weekly flow prints will show whether institutional demand stabilizes or the withdrawal trend extends.
Beyond ETF withdrawals, derivatives market data suggests traders are increasingly positioning for further downside. Per CoinGlass, XRP's long-to-short ratio declined to 0.89 on Monday, approaching its lowest level in more than a month. A ratio below one indicates that short positions outnumber long positions in the measured market, suggesting traders are leaning toward further price declines.
Additional data from CryptoQuant reinforces this outlook. The analytics platform's market summary shows large whale orders across XRP's spot and futures markets, accompanied by persistent sell-side dominance. That combination suggests larger market remain active while selling pressure continues to outweigh buying demand. CryptoQuant also identifies heating conditions in the spot market, indicating heightened trading activity during the ongoing correction.
Macroeconomic developments have created additional challenges for XRP as investors reassess the outlook for US monetary policy. Stronger-than-expected US Nonfarm Payrolls (NFP) data released last week reinforced expectations that the Federal Reserve could maintain restrictive interest rates for longer or introduce another rate increase. According to CME FedWatch figures, traders are pricing in approximately a 78.7% probability of a December interest rate hike, up from 72.8% before the employment report. Rate expectations matter well beyond XRP: digital assets generally trade as risk-sensitive holdings, so expectations of higher-for-longer borrowing costs tend to dampen appetite across the sector. That places the Federal Reserve's December policy meeting squarely on the calendar as the next major macro event for crypto traders to watch.
Technical Picture: Sellers Eye the Psychological $1 Level
XRP's technical outlook remains bearish, with the cryptocurrency trading well below its major moving averages.
At the time of writing on Monday, XRP changes hands near $1.097 following a sharp weekly decline that has left buyers struggling to regain control. The token sits below its 50-day, 100-day, and 200-day Exponential Moving Averages (EMAs), which are clustered between $1.302 and $1.360. This forms a significant resistance zone, suggesting that any meaningful recovery attempt could encounter substantial selling pressure.
Momentum indicators also point to continued weakness. The daily Relative Strength Index (RSI) stands near 26, placing XRP firmly in oversold territory, while the Moving Average Convergence Divergence (MACD) histogram remains negative, reinforcing the prevailing bearish momentum. Oversold readings, however, can persist for extended stretches in strong downtrends, so momentum signals alone do not guarantee a reversal.
With XRP trading near recent lows, sellers could attempt another push toward the psychological $1 support level. A decisive breakdown below that threshold would represent a significant technical setback and could encourage further selling, although additional support levels would need to be established.
Despite the prevailing bearish conditions, XRP could stage a temporary rebound if buyers capitalize on oversold momentum readings. The first important resistance level stands at $1.160, which bulls would need to reclaim to establish an initial recovery. A sustained move above that barrier could open the door for a broader advance toward $1.300, where stronger selling interest may emerge.
Beyond that level, XRP faces additional resistance from the 50-day EMA at $1.302 and the 100-day EMA at $1.307. The 200-day EMA at $1.360 represents another major hurdle that buyers would need to overcome before the broader technical outlook begins to improve.
Source: CoinJournal

