XRP Hovers Near $1 Support as Network Activity and ETF Inflows Weaken
Key Takeaways
- •XRP traded around $1.07, roughly 70% below its all-time high of $3.65 reached in July 2025.
- •Weekly price action remains bearish, and a confirmed drop below $1 would strengthen the downside case.
- •XRP Ledger transactions fell to 403,000 per day, down sharply from a year-to-date high of 2.1 million.
- •Active accounts declined to below 9,000 from more than 31,000 earlier this year, while the daily XRP burn rate stayed below 300 coins.
- •XRP ETF inflows slowed to $2.25 million for the week, and RLUSD market capitalization slipped to $1.71 billion.
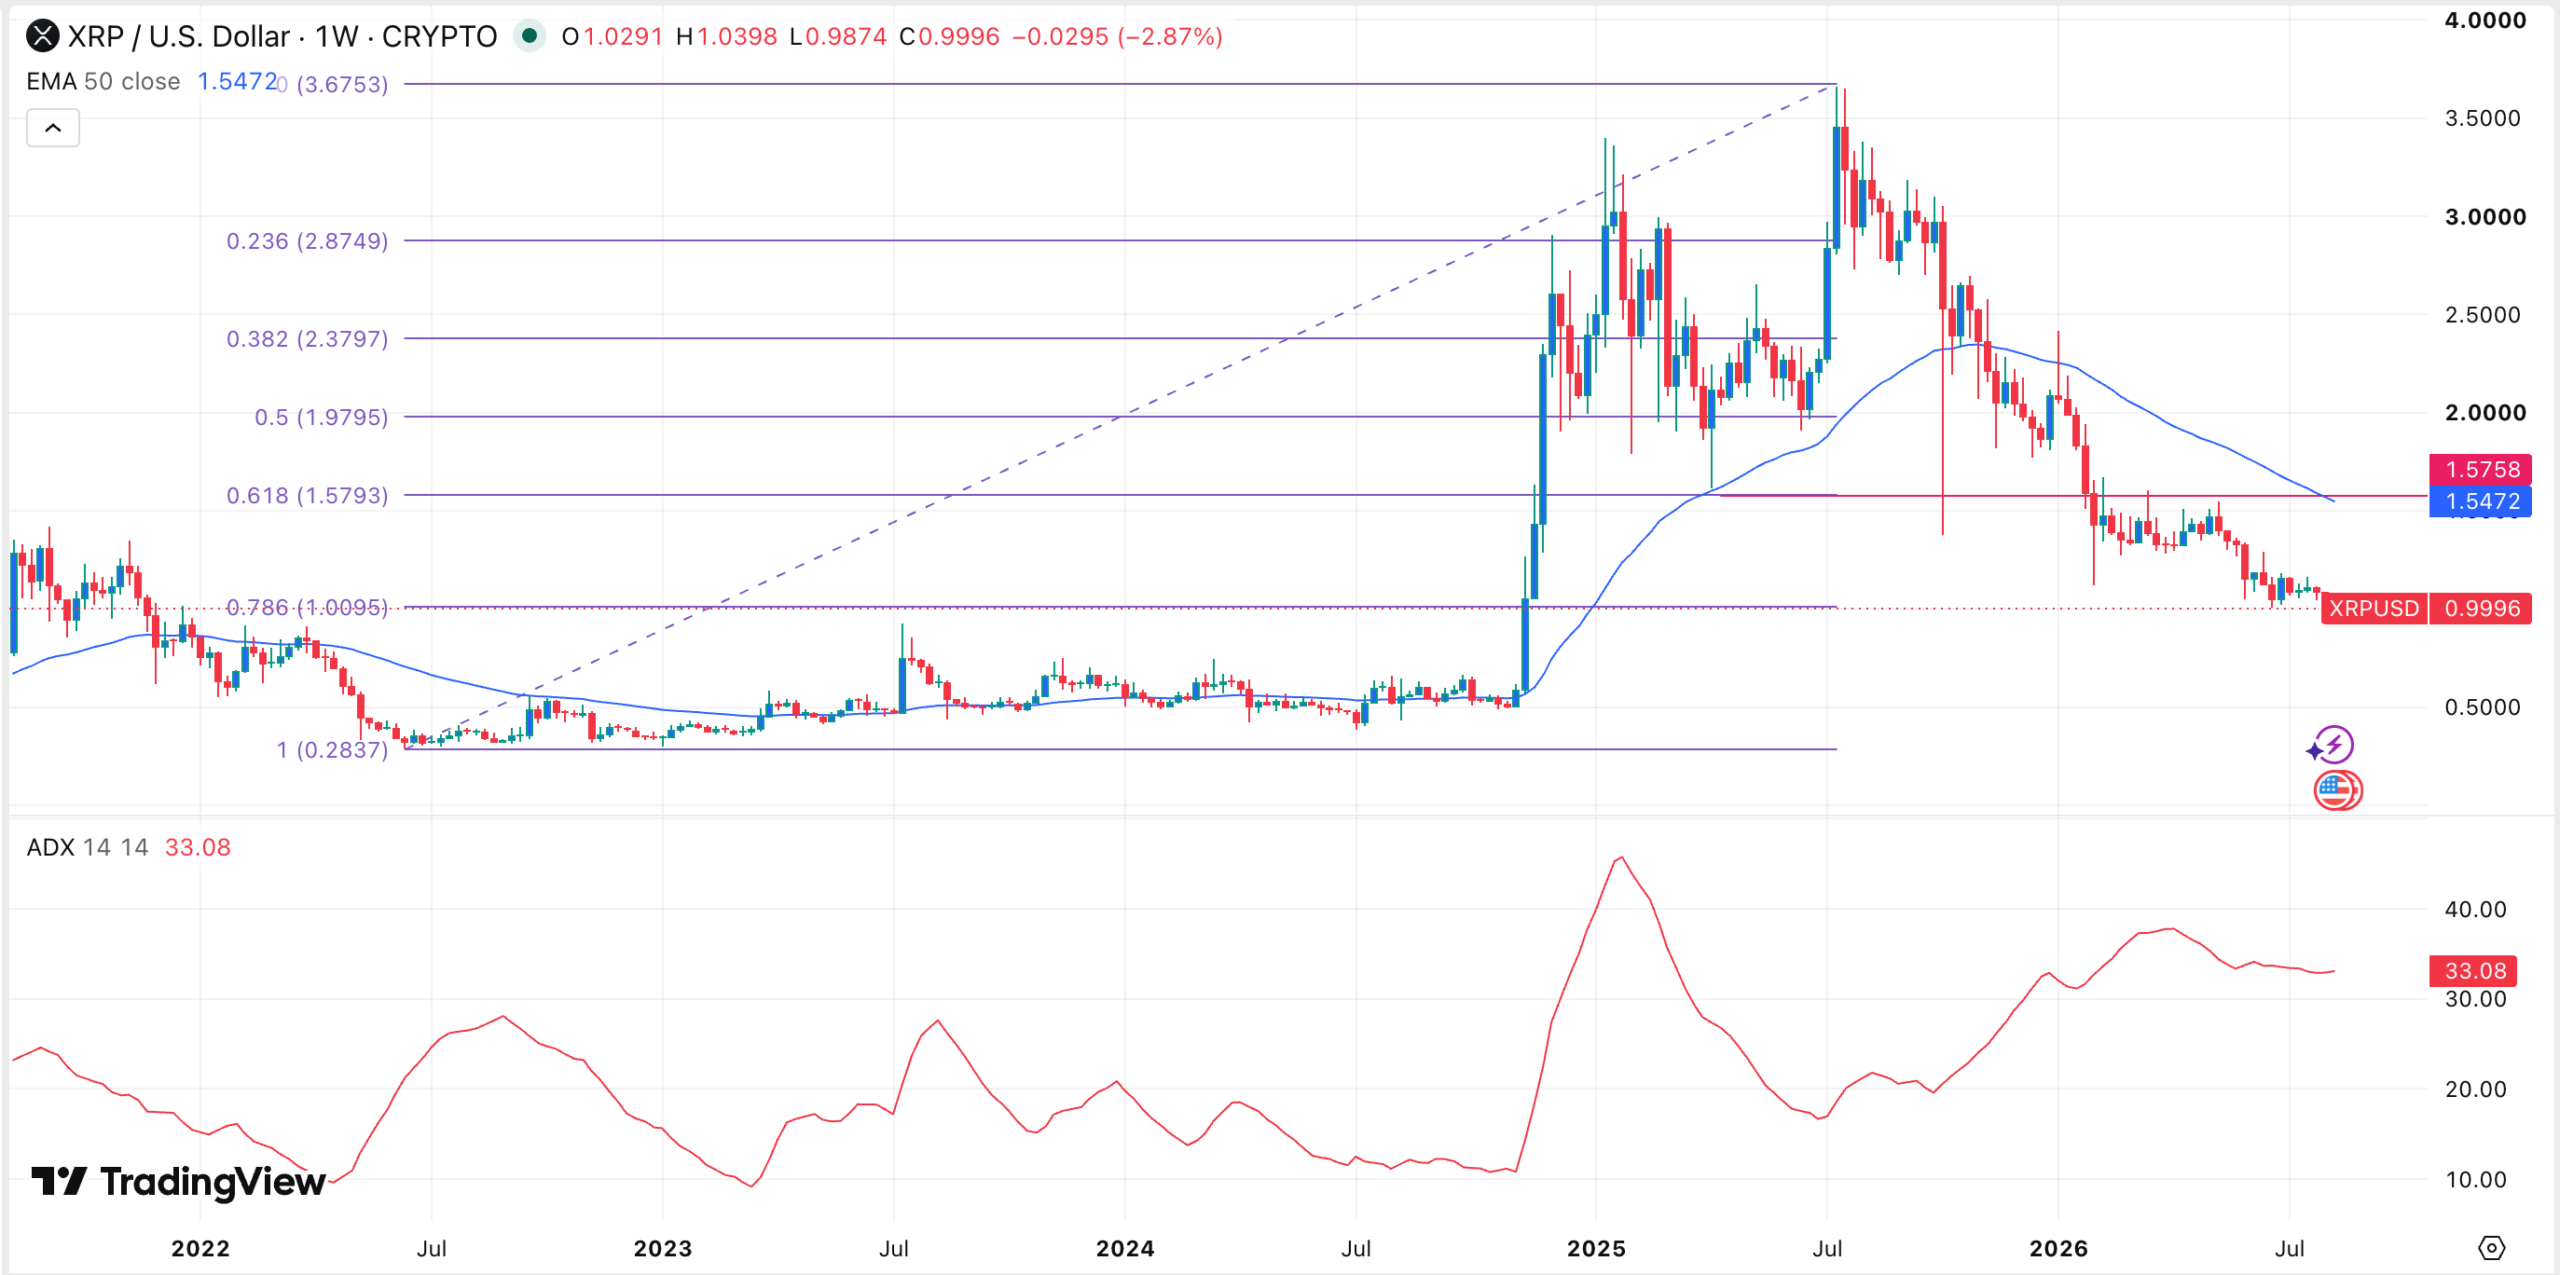
XRP remained near its crucial $1 support level as the broader cryptocurrency market struggled. Round-number levels such as $1 often act as psychological reference points for traders, one reason the area has drawn close attention. The token traded around $1.07, roughly 70% below its all-time high of $3.65 reached in July 2025, according to CoinGecko data. Its technical structure stayed bearish, while several fundamental indicators pointed to weakening activity.
Key developments:
- XRP held near $1 after falling about 70% from its all-time high.
- XRP exchange-traded fund inflows slowed as network activity remained under pressure.
- Ripple USD supply growth stalled while XRP futures positioning stayed below previous highs.
Technical Setup Points to Further Downside
The weekly XRP chart showed the token locked in a prolonged downtrend, trading near its lowest levels since late 2024 after falling sharply from last July's peak. Price has approached the 78.6% Fibonacci retracement area around the $1 support zone — a level chart watchers derive from key ratios of the distance between the prior cycle's high and low and use to mark potential support — and a sustained break below that level could weaken the current structure further.
The 50-week and 200-week weighted moving averages also continued to converge. A bearish crossover, if confirmed, would add another negative technical signal; crossovers between these long-horizon averages are widely followed as rough gauges of shifting momentum rather than precise timing tools.
Meanwhile, the Average Directional Index (ADX) stood near 33 on the weekly chart. Readings above 25 generally indicate a relatively strong trend, although the ADX does not determine whether a trend is bullish or bearish; XRP's declining price structure provides the bearish directional signal.
A confirmed break below $1 could expose lower support levels. The psychological $0.50 area would represent a deeper bearish scenario rather than a confirmed target. Conversely, a sustained move above $1.5472, the level corresponding with the 61.8% Fibonacci retracement area on the chart, could weaken the bearish setup.
On-Chain Fundamentals Have Weakened
Several important fundamentals suggest that XRP may be heading for a strong bearish breakout in the coming days or weeks, according to the analysis.
The number of transactions on the XRP Ledger — the blockchain on which XRP serves as the native asset — has continued to fall this month. The daily figure dropped to 403,000 on Saturday, down sharply from the year-to-date high of 2.1 million — a sign that network usage continues to deteriorate amid the ongoing crypto winter.
Active accounts also remained in a downward trend, moving from a year-to-date high of more than 31,000 to below 9,000. These numbers have contributed to a low XRP burn rate, with fewer than 300 coins burned daily. Because every XRP Ledger transaction destroys a small fee and permanently removes XRP from supply, the burn rate moves in tandem with overall network usage.
ETF Demand and Stablecoin Growth Have Cooled
Demand for XRP ETFs — exchange-traded funds that hold the token directly and began listing in the United States in 2025, letting investors gain exposure through ordinary brokerage accounts — has continued to fall this month. There were no inflows on Friday, weekly inflows came to $2.25 million, and monthly inflows stood at just $3.27 million — far below the record high of $131 million experienced in May. All XRP ETFs have recorded cumulative inflows of $1.51 billion, bringing total assets to $933 million.
According to the report, falling inflows signal that American retail and institutional investors do not expect the price to rise, and the slowdown may reflect rotation into other assets — especially the stock market, as the AI boom continues.
Demand for Ripple USD (RLUSD) — the dollar-pegged stablecoin Ripple launched in late 2024 to support payments and liquidity on its network — has also waned over the past few months. Its market capitalization has dropped to $1.71 billion, down from a year-to-date high of $1.83 billion. The decline mirrors that of other top stablecoins, including USD Coin (USDC), which has slipped to $72 billion from its all-time high of $80 billion.
Futures open interest has dropped to $2.6 billion from last year's high of $10.5 billion, indicating that demand in the perpetual futures market has weakened.
Balanced Picture Near Long-Term Support
XRP's technical structure remains weak while the price trades near long-term support. Softer network activity and slower investment-product demand add pressure, but neither confirms another breakdown. A sustained loss of $1 would strengthen the bearish case, while a recovery above $1.55 would weaken it. For observers, the metrics cited above — the $1 level, the still-unconfirmed 50- and 200-week moving-average crossover, weekly XRP Ledger transaction and account counts, and the pace of ETF inflows and stablecoin growth — serve as the observable checkpoints for whether the bearish case strengthens or fades.

