XRP Escapes the $1 Zone; $1.267–$1.276 Resistance Cluster Is the Next Test
Key Takeaways
- •XRP's recovery faces a dense resistance zone where the 0.5 Fibonacci retracement at $1.267 coincides with the 200-day SMA at $1.276.
- •CoinGlass data show XRP futures logged $20.30 million in net inflows over 24 hours while spot markets posted a net outflow of $2.56 million, indicating the rally was driven mainly by leveraged derivatives activity rather than organic spot buying.
- •U.S. spot XRP ETFs recorded $2.35 million in net inflows during the August 19 session, with Bitwise contributing $1.19 million and Franklin $1.16 million, according to SoSoValue.
- •A daily close above $1.201 is viewed as essential to keep the rebound structurally intact, and a confirmed break above the $1.27 resistance cluster would bring the 0.618 Fibonacci level at $1.33 into view.
- •Downside support levels for XRP include the 100-day SMA at $1.15, the 0.236 retracement at $1.118, the 50-day SMA at $1.07, and August's low near $0.98.
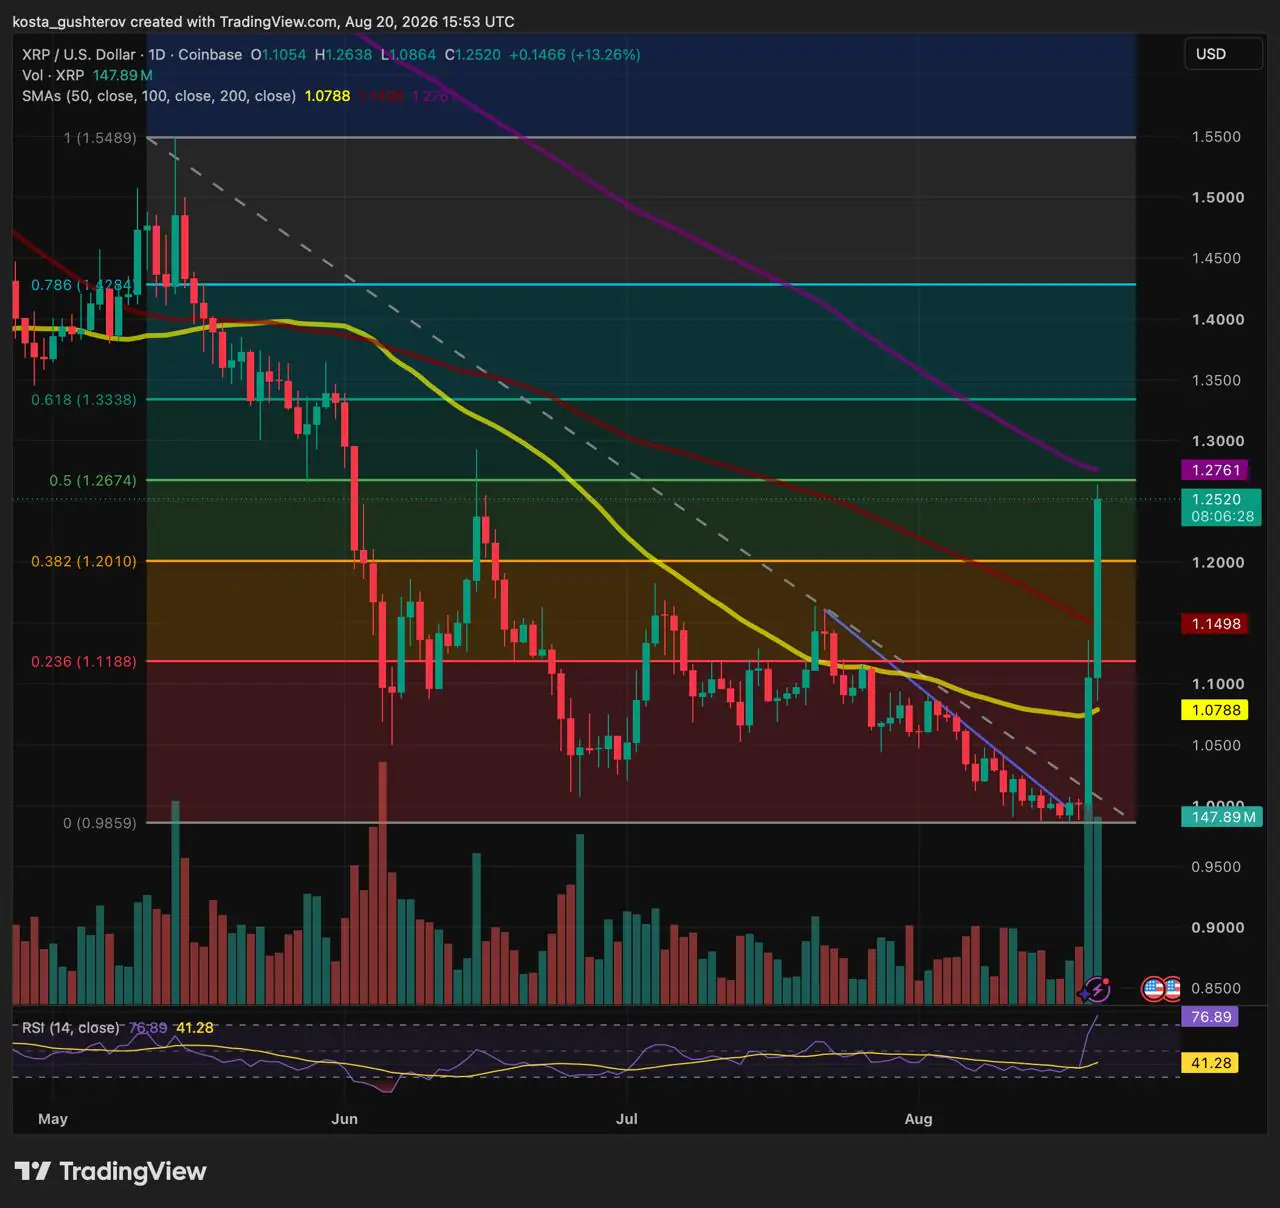
XRP has climbed back out of the $1 area, but the recovery now runs into a densely packed resistance zone stretching from the 0.5 Fibonacci retracement at $1.267 to the 200-day simple moving average (SMA) at $1.276. Order-flow data from CoinGlass show that aggressive futures buying outpaced spot demand during the rally, placing added importance on defending $1.201 on any daily close. In a quieter corner of the market, U.S. spot XRP ETFs recorded $2.35 million in net inflows during the prior trading session.
The $1.20 close that could change the chart
XRP is the cryptocurrency associated with Ripple, whose cross-border payments network is the token's flagship use case, and it ranks among the largest digital assets by market value. The Fibonacci levels in question are drawn from XRP's swing low near $0.98 to its high at $1.54, carving the recent pullback on the XRPUSD chart into zones traders use to judge whether a relief rally builds a foundation or rolls over. Those retracement ratios — 0.382, 0.5, 0.618 and their neighbors — are staples of technical analysis, marking where a pullback commonly finds support or stalls; the 0.5 line simply bisects the measured swing.
Moving back above the 0.382 retracement at $1.2 is a positive step, but a daily close above that marker carries far more weight than an intraday flash through it. If buyers can cement a close above $1.2, that line transforms from a former ceiling into a possible safety net during pullbacks.
Slipping back below it would strip the breakout of its teeth. XRP would drift into the lower half of its range, making the move look less like a confirmed trend reversal and more like a violent dead-cat bounce off parity.
The next barrier is a zone, not one price
The 0.5 Fibonacci retracement rests at $1.267, sitting directly on top of the 200-day SMA at $1.276. That convergence gives the $1.27 neighborhood significant technical gravity.
The 200-day SMA averages the past 200 daily closes and serves as a benchmark for the broader trend. The measure originated in traditional equity analysis and carries over into crypto charting as one of the most widely watched gauges of whether a broader trend has turned. A recovery that stalls out beneath it has not actually repaired the wider downtrend. XRP does not need to obliterate the hurdle in a single green candle, but bulls must prove that sellers cannot continuously hammer the price back down.
Clearing the $1.267–$1.276 barrier on a daily close would bring the 0.618 Fibonacci level at $1.33 into view. That is simply the next logical destination on the map, and it only matters if buyers first secure acceptance above the 0.5 Fib.
On the downside, the first line of defense is $1.2. Lose that, and the chart pivots to the 100-day SMA at $1.15, followed by the 0.236 retracement at $1.118. Deeper down, the 50-day SMA sits at $1.07, with August's low near $0.98 acting as the ultimate line in the sand for the recovery.
Futures drove the rally, but spot demand lags
A look beneath the surface of the order flow explains why traders are exercising caution near resistance. CoinGlass figures logged $20.30 million in positive XRP futures net flow over 24 hours, while spot markets ran a net negative of $2.56 million. During the peak 12-hour acceleration window, derivatives trading drew $58.69 million in net inflows, compared with a modest positive spot reading of $10.11 million.
That divergence matters. Perpetual futures — crypto's dominant derivative product — let traders take leveraged exposure without holding the token itself, and exchanges force-close positions when losses mount, a mechanism that can compound price moves in either direction. The rally was not a slow, organic accumulation by cash buyers; it was a high-octane derivative push. Aggressive leverage can trigger powerful short squeezes, but it also leaves the market vulnerable if leveraged longs capitulate right at major resistance.
CoinGlass tracks trade direction via market orders snapping up asks or hitting bids, and it does not differentiate between fresh longs and short covers. Even so, the message is clear: the urgency came from the futures pit. The silver lining was the positive spot activity during the strongest 12-hour stretch. For the recovery to shake off its leverage-heavy reputation, spot buyers would need to show up in force as XRP tests the $1.27 region.
ETF flows add a quieter source of demand
U.S. spot XRP ETFs chipped in $2.35 million in net inflows during the August 19 session, according to SoSoValue data, which aggregates the figures from issuer disclosures. Bitwise led the pack with $1.19 million, followed by Franklin at $1.16 million.
While small change compared with derivatives volume, the distinction is significant. Spot ETFs hold the token directly and trade on U.S. stock exchanges, so these purchases represent organic cash allocations through regulated wrappers that investors can access from an ordinary brokerage account. ETF tallies cannot be merged directly into CoinGlass order books, but consistent institutional inflows give the token structural ballast that pure derivatives trading cannot match.
What bulls must defend, and what sellers want to reclaim
- Daily close above $1.2: Holding the 0.382 Fib keeps the rebound structurally intact.
- Acceptance above $1.27: A fleeting wick past the 0.5 Fib or the 200-day SMA is not enough; the market needs a confirmed close followed by a successful retest.
- A drop back below $1.201: Dragging the price under that floor brings $1.15 and $1.11 back into play for sellers.
- Spot demand as the ultimate litmus test: Leverage can punch through resistance, but spot accumulation is what makes prices stick.
XRP's bounce off the $1 floor is impressive, but the easy part is over, the analysis argues. The real test is turning raw momentum into structural acceptance, starting with a daily close over $1.201 and a clean break of the $1.27 resistance cluster.
This article is provided for informational purposes only and does not constitute investment advice.

