XRP Slips Below $1 as Two-Year Support at $0.985 Gives Way
Key Takeaways
- •XRP dropped below $1 on Saturday, trading at $0.987 and marking its first dip under the $0.985 support level since November 2024.
- •The token now trades roughly two-thirds below its July 2025 peak above $3, with rallies since then stalling at progressively lower highs near $2.40, $1.6, and $1.7.
- •The 14-day RSI closed at 19.25, the most oversold reading since the chart began in late 2024, while daily turnover of 53.64 million XRP is far below the volume seen during the 2024-25 breakout and the August 2026 low.
- •The daily chart shows almost no consolidation between $0.98 and the $0.50 base, though weekly and monthly timeframes identify a $0.84 to $0.90 support band roughly 8% to 14% below Saturday's price.
- •A close back above the $1.01 open would turn the break into an intraday wick pointing toward the $1.30-$1.50 range, while a close under $0.98 would make the August low resistance and leave $0.50 as the next daily reference.
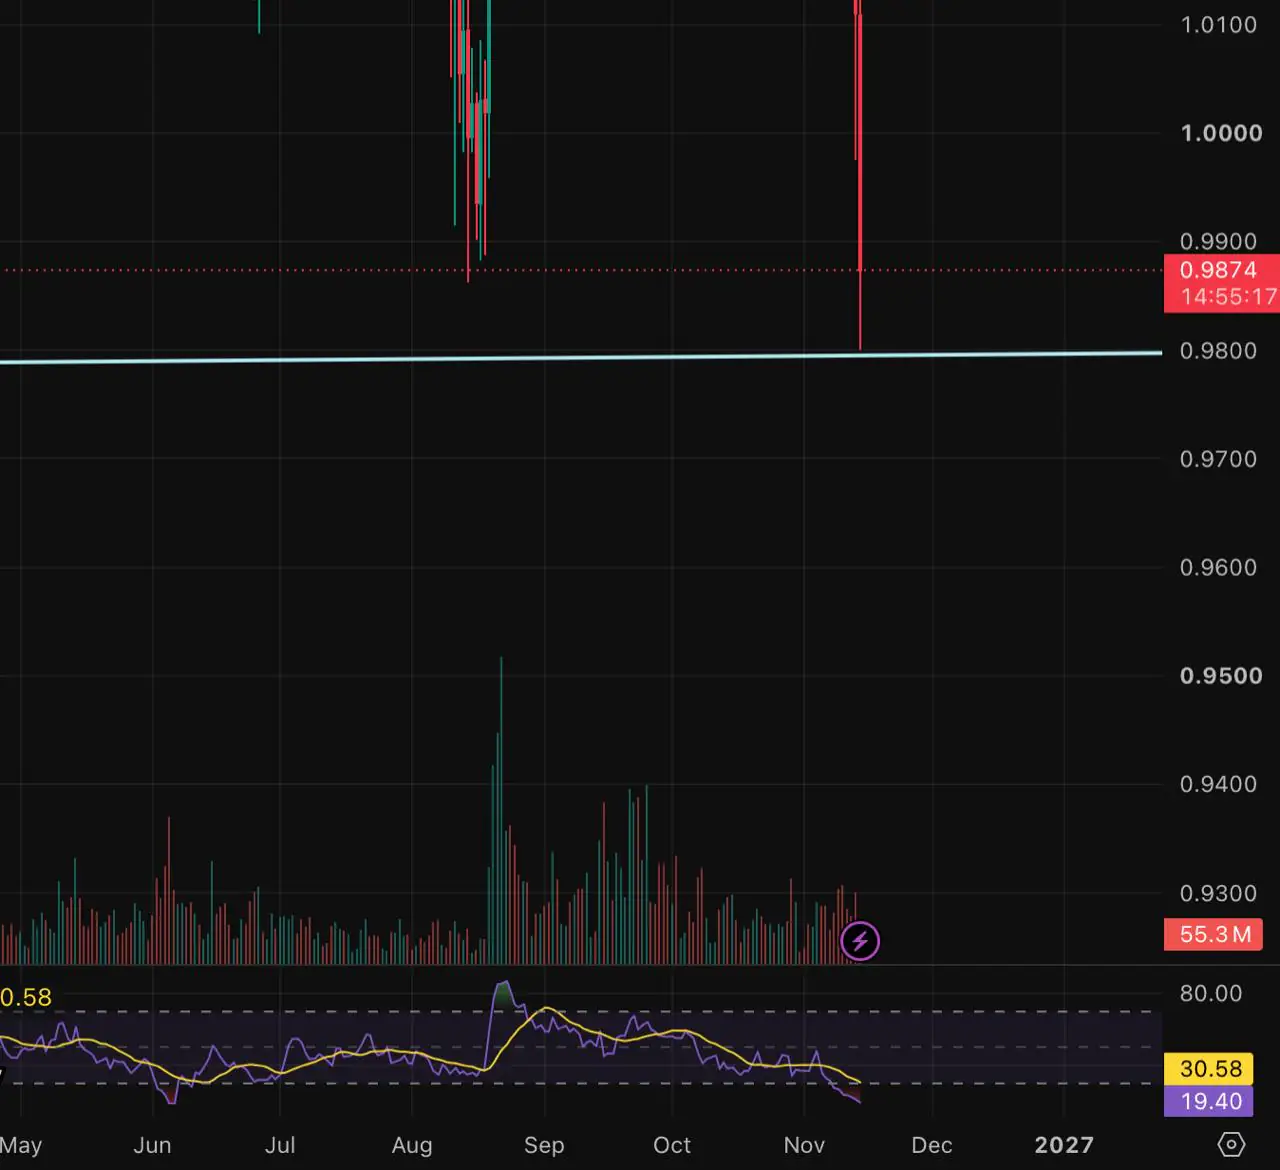
XRP slipped below $1 on Saturday, breaking through the $0.985 floor that has underpinned the token since 2024. On Binance's daily XRP/USDT chart, the session's candle opened at $1.01, printed a high of $1.01 and a low near $0.98, and was trading at $0.987 at the time of writing, down 2.6% since the beginning of the day.
The low sits half a cent beneath the $0.985 level XRP bottomed at in August 2026, the point from which the autumn rally began. Saturday therefore marks the first time the coin has traded under $0.985 since November 2024, when it was moving up through this area rather than down into it.
Above the broken floor, the ceiling has been falling for sixteen months. From the peak above $3 in July 2025, each rally has stopped at a lower level: about $2.40 in January, around $1.6 in May and $1.7 in September. The last two are close enough that this is not a textbook sequence of lower highs, but the shape is the same — a flat floor under a roof that keeps coming down, with each test of the floor arriving from a lower starting point. In all, the token now trades roughly two-thirds below that July 2025 peak.
Two Readings That Point Different Ways
The RSI (14), a momentum gauge that scores the pace of recent price changes on a scale from 0 to 100, closed into Saturday at 19.25, below its signal line at 30.57 and under the 30 threshold by a wider margin than at any point since the chart begins in late 2024. The troughs of October 2025, February 2026 and August 2026 all bottomed higher. Taken on its own, that is the strongest oversold reading XRP has produced in this downtrend, and the August bounce began from a shallower one.
Volume tells a different story. Daily turnover stands at 53.64 million XRP, a fraction of the bars printed during the November 2024 to January 2025 breakout and smaller than the spikes that marked the August 2026 low. A floor breaking on thin volume can mean sellers are tired; it can also mean buyers have not shown up yet. The chart does not settle which, and the broader market argues against assuming the first. Bitcoin is near $67,000 and Ethereum around $1,850, both still falling, so the oversold reading on XRP is arriving while the whole market is flashing the same signal at once.
What the Daily Chart Has Under $0.98, and What It Does Not
The left side of the chart is the problem for anyone counting on a soft landing. Because the November 2024 move was vertical, there is almost no consolidation between $0.98 and the $0.50 base from which it started: no range that held for weeks, no volume shelf, nothing on the daily chart that previously turned price around. On this timeframe, the space below Saturday's low is an air pocket, and the only daily reference underneath is the origin itself at $0.50, roughly half of Saturday's price.
The weekly and monthly charts fill some of that gap. The $0.84 to $0.90 band Coindoo mapped on Wednesday stacks four higher-timeframe supports inside six cents, roughly 8% to 14% below Saturday's price, and it is the first place the longer charts give buyers a reason to act. The daily chart does not see those levels. That is why a daily breakdown and a weekly test can be the same event described two ways.
How the Close Could Be Read
Fifteen hours of trading separate the three scenarios below, and the one that applies will be decided by where the candle finishes rather than where it stands now. Each is a reading the chart allows, not a call on which will arrive.
Floor Holds
If XRP finishes Saturday back above the $1.01 open, with the RSI turning up from 19 toward its 30.57 signal line, the week's break becomes a wick — an intraday dip the close leaves behind — below a level that has held for two years. Under that reading, the daily structure points back toward the $1.30 to $1.50 range that contained price for most of the first half of 2026, with the 200-week average at $1.28 the first higher-timeframe level a recovery would meet. The RSI resetting above 30 is the confirmation that argument needs; a close above $1.01 without it leaves the question open.
Floor Goes
A daily close under $0.98, followed by a failure to get back above $0.985 on the next approach, would mark the August low as resistance rather than support. Volume is the tell here: a close below $0.98 on turnover above Saturday's 53.64 million would show the break attracting sellers rather than exhausting them. On the daily chart, the next reference is $0.50. On the weekly, the $0.90 to $0.84 band comes first, and how price behaves there would decide whether the daily air pocket is crossed at all.
What Neither Close Changes
Even a strong bounce from here would leave XRP below every weekly and monthly average on the longer charts, inside the descending channel from the 2025 high, and in a market where the two largest assets are still falling. Saturday's candle can answer whether $0.98 holds for now. It cannot answer whether the downtrend that started above $3.00 is finished, and the RSI, however stretched, is a statement about speed, not direction.
This article is for informational purposes only and is not financial or investment advice. The levels and scenarios described are based on technical analysis of public chart data and do not guarantee future price movements. Cryptocurrencies are volatile, so do your own research before making any trading or investment decision.

