XRP Tests $1.60 Resistance as Peter Brandt Points to $5.40 Long-Term Level
Key Takeaways
- •XRP rose roughly 4.4% in 24 hours and 13.5% over seven days to trade near $1.57 on September 22, with a candle high of $1.595 coming within about 0.3% of the $1.60 resistance that marks the 78.6% Fibonacci retracement.
- •Unlike its late-August approach, this recovery followed a break above the descending trendline and successive clearance of the 38.2%, midpoint, and 61.8% retracement levels, creating potential support zones between the current price and the September low near $1.245.
- •Veteran trader Peter Brandt published a monthly XRP chart on September 21 implying an eventual advance to $5.40, but he emphasized that posting a chart is not a trade call and provided no timeline.
- •A CoinDesk analysis found that XRP Ledger second-quarter order-book trading rose 79% year over year while the number of accounts initiating trades fell about 41%, with average tokenized-asset and RLUSD balances near $4.26 billion.
- •With the four-hour RSI near 78 and the 50-period moving average still below the 200-period average, momentum supports the rebound but a sustained trend reversal remains unconfirmed.
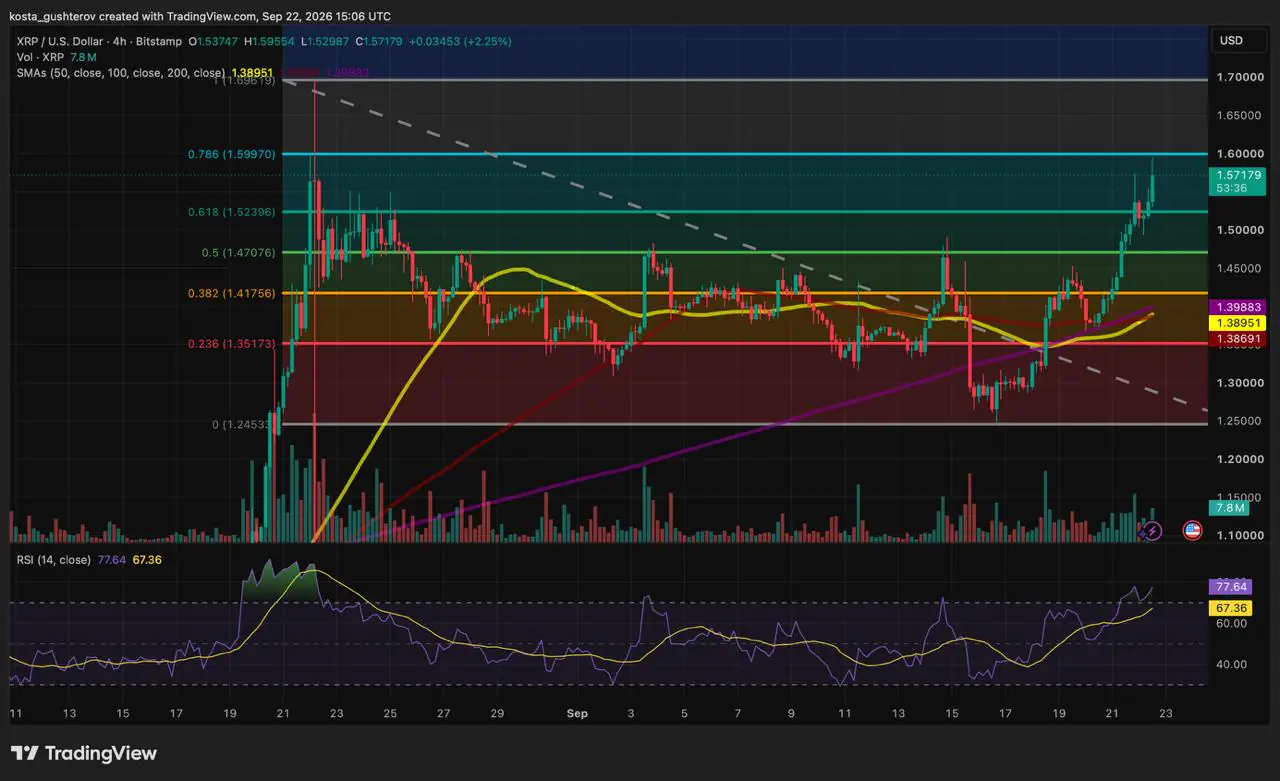
XRP traded near $1.57 at 15:06 UTC on September 22 after gaining approximately 4.4% over 24 hours and 13.5% over seven days, according to CoinMarketCap when checked. The move brought the token to a familiar technical barrier at $1.60, while veteran trader Peter Brandt presented a longer-term chart implying an eventual advance to $5.40.
XRP approaches the 78.6% retracement
The Bitstamp XRP/USD four-hour chart recorded a candle high of $1.595, placing XRP within roughly 0.3% of the 78.6% Fibonacci level at $1.60. The Fibonacci scale measures how much of XRP’s decline from the August high near $1.70 to the subsequent low around $1.245 has been recovered. Reaching $1.60 would mean that approximately 78.6% of that decline had been erased. Fibonacci retracements drawn this way are a standard reference tool in technical analysis, and 78.6% is among the deepest conventional levels before a full return to the prior high.
The $1.60 level is the highest retracement displayed on the chart before the August peak and is therefore the nearest resistance above the current price. XRP had approached the level but had not moved through it when the chart was captured.
The four-hour candle remained open, making the move an active test rather than a confirmed rejection. A wick near $1.60 indicates that selling appeared at the level, but it does not establish whether that supply will remain during a subsequent attempt.
The relevant Bitstamp XRP/USD chart also shows that XRP is trading above its 50-, 100- and 200-period simple moving averages on the four-hour timeframe. The averages are tightly grouped between approximately $1.387 and $1.399, marking the area where the market spent much of September reaching a temporary balance.
August produced a similar reaction at $1.60
The previous encounter gives $1.60 significance beyond the Fibonacci calculation. During the late-August rally, XRP reached approximately the same level and initially pulled back toward the mid-$1.40s. A second advance then carried the token through $1.60 and to a local high near $1.70.
That breakout did not establish lasting support. XRP later surrendered the advance and fell to approximately $1.245 on September 16. It has since recovered by roughly 26% from that low.
The late-August sequence consisted of an initial pause near $1.60, a pullback toward the mid-$1.40s and a second push to approximately $1.70. The current sequence instead includes a recovery from approximately $1.245, a break above the descending trendline and a first pause immediately below $1.60.
The August move demonstrates that XRP can pause at $1.60 and still advance, but it does not make another move to $1.70 automatic.
The path back to $1.60 has changed
The resemblance between the two moves ends at the resistance level itself. The route XRP took back to $1.60 provides additional context for the current attempt.
The most important structural change occurred before XRP reached the Fibonacci barrier. Price broke above the descending trendline connecting the lower highs formed after the August peak. It then cleared the 38.2% retracement near $1.418, the midpoint at $1.471 and the 61.8% level around $1.524.
A previous Coindoo analysis identified the low-$1.40s as the barrier facing the recovery. XRP has now moved through that area and created several possible support levels between its current price and the September low.
The token therefore did not jump directly from $1.25 to $1.60. It recovered sections of the previous decline one at a time, providing clearer reference points for the next pullback.
Brandt’s view covers a different time frame
Peter Brandt, a veteran trader known for classical chart analysis across commodities and crypto markets, added a longer-term perspective on September 21. In an X post containing a monthly XRP chart, Brandt said the structure implied an “eventual advance” to $5.40:
This is my long-term chart of ripple:native It implies an eventual advance to $5.40 A claim of a “call” or simple presentation of a chart is NOT a trade People who claim “trades” need to provide proof or else the claims are BS An X post is NOT proof pic.twitter.com/Szu6FiZq2T — The Factor Report (@PeterLBrandt) September 21, 2026
Brandt also emphasized that publishing a chart is not evidence of an actual trade or a recommendation to buy. No deadline accompanied the projection. The caveat is notable because chart posts from prominent traders are often recirculated as though they were trade calls.
Brandt’s analysis covers a multi-year monthly structure, while the $1.60 test discussed here comes from a four-hour chart. The two time frames are not interchangeable. XRP would first have to clear $1.60, reclaim the August high near $1.70 and overcome additional resistance before a distant level such as $5.40 became relevant.
The network backdrop is mixed rather than uniformly positive. XRP is the native asset of the XRP Ledger, the network whose activity a September CoinDesk analysis examined. The analysis found that second-quarter order-book trading increased by 79% from a year earlier. However, the number of accounts initiating those trades fell by approximately 41%.
That indicates that more XRP was changing hands through a smaller group of active accounts. CoinDesk also reported that average tokenized-asset and RLUSD balances on the network reached approximately $4.26 billion during the quarter.
The figures show that larger-value activity is developing on the XRP Ledger, but they do not prove that network use caused the latest price increase or that demand will be sufficient to clear $1.60.
Momentum supports the rebound, but the trend is not fully repaired
Moving averages have not completed a bullish alignment
A conventional bullish alignment would place the 50-period moving average above the 100-period average, with both above the 200-period average. XRP has not reached that arrangement: the 50-period average is slightly above the 100-period average but remains below the 200-period average.
Price has therefore improved faster than the slower indicators can reflect. Trading above all three averages strengthens the short-term recovery, but their current order does not confirm a sustained trend reversal.
The moving-average cluster is approximately 12% below XRP’s current price. It could become relevant during a deeper correction, but it is too distant to provide immediate support.
RSI confirms the rise and shows its speed
The four-hour relative strength index reached approximately 78, showing that XRP arrived at $1.60 after a rapid recovery rather than a long period of consolidation. Readings above 70 are conventionally classified as overbought, so the 78 print places the four-hour chart well inside that zone.
There is no clear bearish divergence on the displayed chart. XRP has made progressively higher September highs, and RSI has risen with them. A bearish divergence would require price to make a higher high while RSI records a lower high; that pattern is not visible yet.
Momentum therefore continues to support the rebound. The risk relates to how much ground XRP has already covered: the token climbed roughly 26% from its September 16 low before reaching resistance. The first pullback may reveal more about remaining demand than the overbought reading alone.
Volume also expanded as XRP crossed $1.47 and $1.52. The latest candle showed approximately 7.8 million XRP in volume, but it was incomplete and cannot yet be compared fairly with completed four-hour candles.
Three price reactions would change the chart
XRP closes and remains above $1.60
A four-hour close above the barrier would provide an initial breakout signal. Remaining above it through a pullback would offer stronger evidence that former resistance is becoming support.
The August high near $1.70 would then become the next established chart reference, approximately 6% above $1.60. It would not be a guaranteed target.
A pullback holds around $1.52
XRP would remain above the 61.8% retracement and preserve most of the latest breakout. That would resemble a test of newly recovered support rather than a complete failure at $1.60.
Price loses $1.52 and $1.47
The recovery would begin surrendering two recently reclaimed levels. Attention would then shift toward $1.418 and the moving-average cluster around $1.39-$1.40.
The next test is whether $1.60 becomes support
XRP has already shown that it can return to $1.60. The more informative test is whether price can remain above the barrier after momentum cools. A move that survives a pullback would provide evidence that $1.60 is changing from resistance into support, something the current wick has not established.
This article is provided for informational purposes only and does not constitute financial or investment advice. Cryptocurrency prices and technical indicators can change rapidly while chart candles remain open.
Source: Coindoo.

