XLM Price Compresses Near Support as Analysts Watch $0.22 Breakout
Key Takeaways
- •XLM is trading near $0.171 after testing the $0.17 support zone for a second time, forming what analysts describe as a potential double bottom pattern on the daily chart.
- •A confirmed breakout above the $0.21–$0.22 neckline resistance could target $0.27–$0.28, while a break below $0.17 would weaken the pattern and expose support near $0.15.
- •Analyst CW reported an accumulation score of 100 out of 100 on the one-hour chart, with price compressed in a tight range between roughly $0.1708 and $0.1733 and a seven-bar active squeeze signaling very low volatility.
- •Laura-Vers identified similarities between the current XLM structure and previous market cycles in 2018 and 2021, placing a speculative third-cycle target near $1.60–$1.80 if earlier patterns repeat over a longer period.
- •MikybullCrypto's three-month chart shows XLM holding a rising support line established after the 2017 breakout, with major horizontal resistance at $0.60–$0.65 that would need to be decisively broken to alter the long-term market structure.
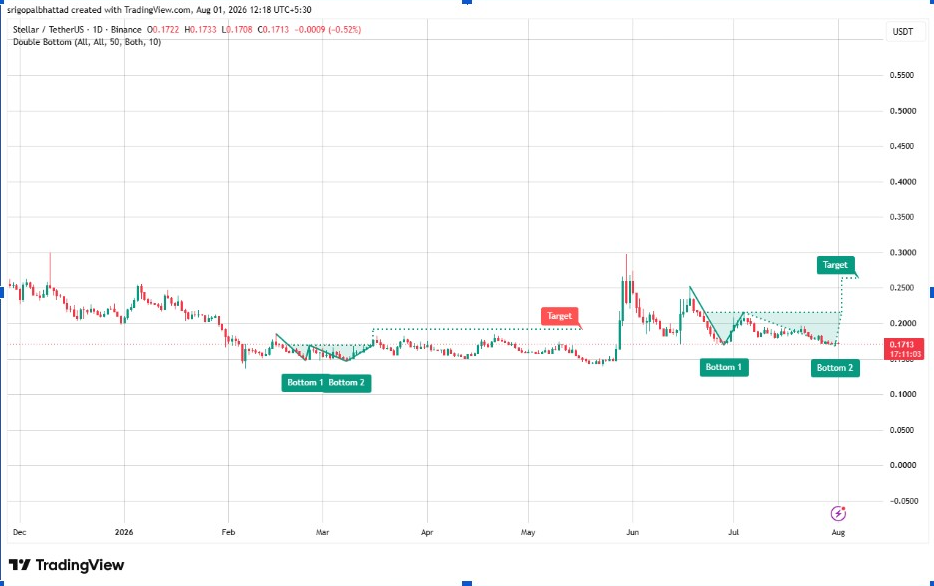
XLM, the native cryptocurrency of the Stellar network focused on cross-border payments and asset tokenization, is holding near $0.171 after buyers defended the daily support area around $0.17. Analysts continue to watch for a confirmed reclaim of $0.21–$0.22 before a larger recovery can take shape.
Several traders say the current range may be forming another accumulation phase. On the daily chart, the setup resembles a possible double bottom, but the structure still needs confirmation. A breakout above the neckline near $0.21–$0.22 could open the way toward $0.27–$0.28. If $0.17 is lost, however, the pattern would weaken and lower support near $0.15 could come into view.
XLM Price Forms Daily Double Bottom
XLM is trading near $0.171 after testing the $0.17 support zone for a second time. Crypto With Gopal described the setup as a potential double bottom on the daily chart.
The first low formed near the end of June after XLM fell from the $0.24 area. Price then recovered toward $0.22 before sellers regained control and pushed it back toward support.
Buyers are now trying to defend the second bottom near $0.17. A sustained rebound would keep the pattern intact and increase pressure on the neckline between $0.21 and $0.22.
A confirmed move above that resistance could clear the path toward $0.27–$0.28. On the other hand, a break below $0.17 would undermine the formation and expose the next support area near $0.15.
XLM Crypto Accumulation Score Reaches Extreme Reading
Analyst CW highlighted an accumulation score of 100 out of 100 on XLM’s one-hour chart, classifying current conditions as extreme accumulation.
Price is compressed inside a tight range between roughly $0.1708 and $0.1733. The chart also shows a seven-bar active squeeze, indicating very low volatility. In technical analysis, such extended periods of tight price compression and low trading volume frequently act as precursors to sharp volatility expansions, though the breakout direction ultimately depends on broader market momentum.
The average true range percentile is near 1%, while Bollinger Band width is around 19%. Trading volume is only about one-quarter of its recent average. RSI is near 49, and ADX at 12.2 points to a weak directional trend.
The indicator gives bulls a 36% confidence reading versus 27% for bears. Even so, the falling MACD histogram suggests buyers still need stronger momentum before a breakout can develop.
Long-Term Cycle Charts Show Familiar Base
Laura-Vers compared the current XLM structure with two earlier market cycles. In both cases, price built an extended base near long-term support before major rallies followed. Historically, extended consolidation phases for alternative cryptocurrencies often correlate with broader macroeconomic liquidity trends and Bitcoin's cyclical market shifts.
The weekly chart shows large expansions in 2018 and 2021, each after a prolonged period of sideways trading near what the analyst describes as a liquidity pool.
XLM now trades near the lower part of that broader structure. An ascending resistance line connecting the peaks from the previous two cycles extends into 2027.
The chart places a speculative third-cycle target near $1.60–$1.80. That projection depends on XLM repeating earlier cycle behavior over a much longer period.
Support near the historical accumulation area provides a constructive base, but the token must clear several resistance levels before any projected third record high becomes technically relevant.
Analysts Map $0.22 and $0.65 Breakouts
MikybullCrypto shared a three-month chart showing XLM holding a rising support line established after the 2017 breakout. Price is now sitting near that trendline at about $0.17.
The broader structure also includes major peaks near $0.60–$0.65, which create horizontal resistance across several market cycles and form a long-term ascending pattern.
A recovery above $0.22 would provide the first confirmation on lower timeframes. Bulls would then face resistance at $0.28, $0.30, and the wider $0.60–$0.65 supply zone.
A decisive break above $0.65 would alter the long-term market structure. MikybullCrypto’s chart shows a strong expansion after that breakout, with much higher targets on the logarithmic scale.
For now, those larger projections remain conditional. XLM first needs to defend $0.17, escape its tight range, and reclaim the daily neckline near $0.22.

