Stellar (XLM) Loses Two Support Levels, Faces Test of 200-Day Average Near $0.1822
Key Takeaways
- •XLM traded near $0.1836 on October 14, down 3.57% on its opening daily candle, after touching a session low around $0.1822 near the 200-day simple moving average.
- •A rebound attempt toward $0.205 failed, leaving XLM below the 61.8% Fibonacci retracement at $0.1850 and the 100-day SMA near $0.1863.
- •The daily RSI stands near 39.1, below its neutral midpoint of 50 and its smoothing line near 49.3, though it remains above the oversold threshold of 30.
- •Any recovery would first need to reclaim $0.1850–$0.1863, with further resistance at $0.195–$0.196, the $0.205 area, and the $0.217 Fibonacci level before the prior peak near $0.237.
- •A daily close below the 200-day average would shift focus to the $0.173–$0.176 cluster of earlier lows, then the 78.6% retracement near $0.1709, and finally the August low at $0.1528, which would erase the full rally.
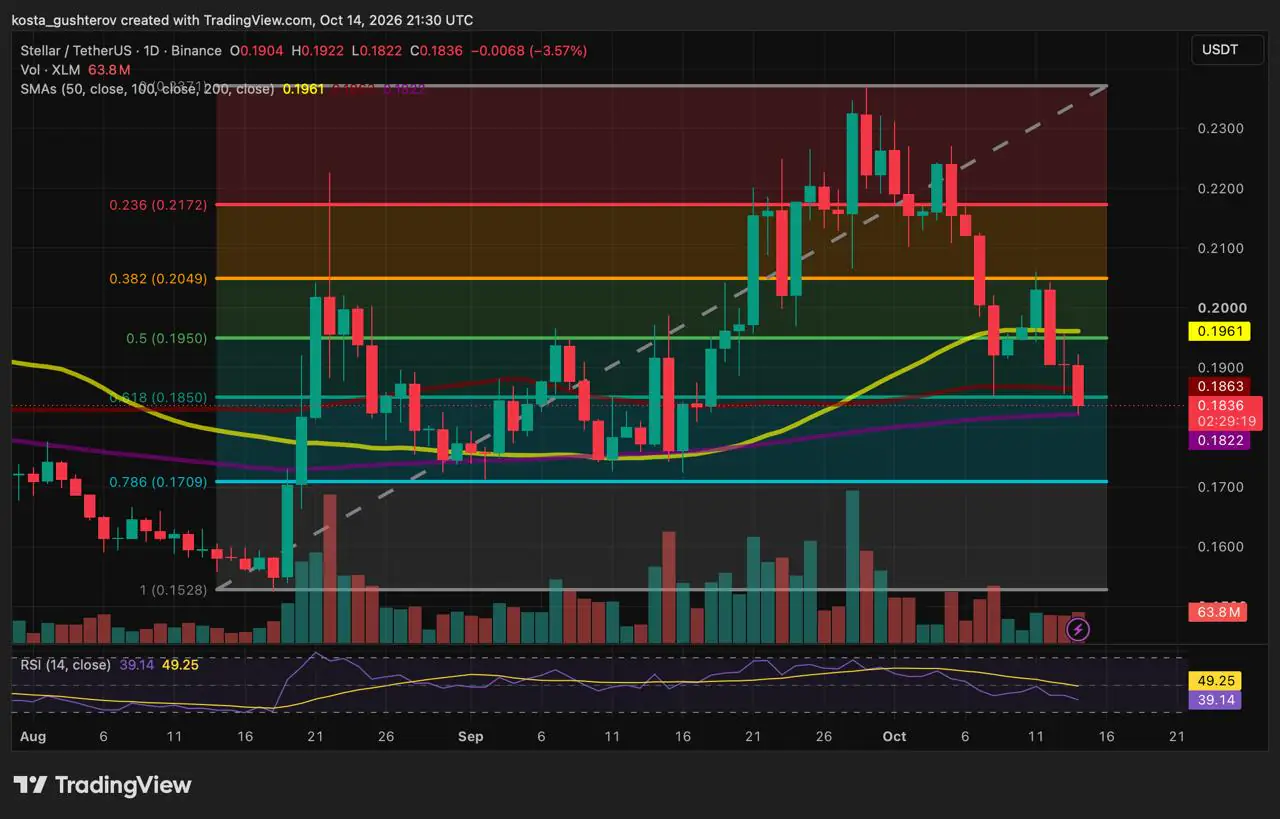
XLM, the native token of the Stellar network, traded near $0.1836 on October 14 at 21:30 UTC, down 3.57% on its opening daily candle, according to the XLM/USDT chart on Binance. The session produced a low near $0.1822, a level sitting approximately at the 200-day simple moving average, and price managed only a slight recovery from that mark. The token now trades roughly 22.6% below its late-September peak near $0.237.
The Fibonacci retracement applied to the chart measures the advance from the August low at $0.1528 to that high, placing the 61.8% retracement near $0.1850 — a level XLM has now lost. Retracement tools of this kind project percentage levels of a completed move, giving traders a shared grid of reference prices between the swing low and high.
Failed rebound sets up the latest slide
The current decline followed a rebound attempt toward $0.205 that could not hold. XLM briefly climbed back above its 50-day average and the $0.1950 retracement, but the advance was not sustained. The subsequent reversal carried price beneath both the $0.1850 level and the 100-day SMA near $0.1863, leaving the 200-day average near $0.1822 as the nearest support. The 200-day simple moving average, calculated from the average closing price over the past 200 trading days, is widely followed as a long-term trend gauge, which is why tests of this level tend to draw heightened attention from chart watchers.
A daily close above that average, followed by the formation of higher lows, would strengthen the case that buyers are containing the decline. For any recovery attempt, the first hurdle sits directly overhead, around $0.1850–$0.1863.
A rebound first needs to recover $0.1850–$0.1863
Moving back above the Fibonacci level and the 100-day average would lift XLM away from its latest low. Holding that zone during a subsequent pullback would help establish a base above the 200-day average.
The next obstacle lies around $0.195–$0.196, where the 50% Fibonacci retracement sits close to the 50-day SMA. XLM crossed through this area during its recent rebound before falling back below it, so another recovery would need to hold these levels to improve on the previous attempt.
Above the round $0.20 mark, the $0.205 area combines the 38.2% retracement with the latest rebound high. Recovering that zone would bring the $0.217 Fibonacci level into view, ahead of the earlier peak near $0.237.
Momentum remains weak. The daily relative strength index (RSI), a 0-to-100 momentum gauge that compares the size of recent average gains and losses, stands near 39.1, below both its neutral midpoint of 50 and its smoothing line near 49.3, though it remains above the usual oversold threshold of 30.
Earlier lows mark support below $0.1822
A daily close below the 200-day SMA, followed by a failed recovery, would strengthen the downside case. Before the $0.17 Fibonacci retracement, the chart shows several lows from August and September clustered around $0.173–$0.176.
XLM rebounded from that band repeatedly before the advance accelerated, and those earlier reactions make it a historical support area to watch if the current decline continues. A sustained move beneath it would put the 78.6% retracement near $0.1709 into focus.
Further below, $0.1528 marks the August low from which the measured advance began. A return to that level would erase the full rally to $0.2371, though XLM would first need to lose the nearer support areas.
This article is provided for informational purposes only and does not constitute financial or investment advice. Technical levels and indicators are interpretive tools, not guarantees of future price movement.

