Crypto Market Breakout: ETF Demand, Short Squeeze, and the Liquidity Test Ahead
Key Takeaways
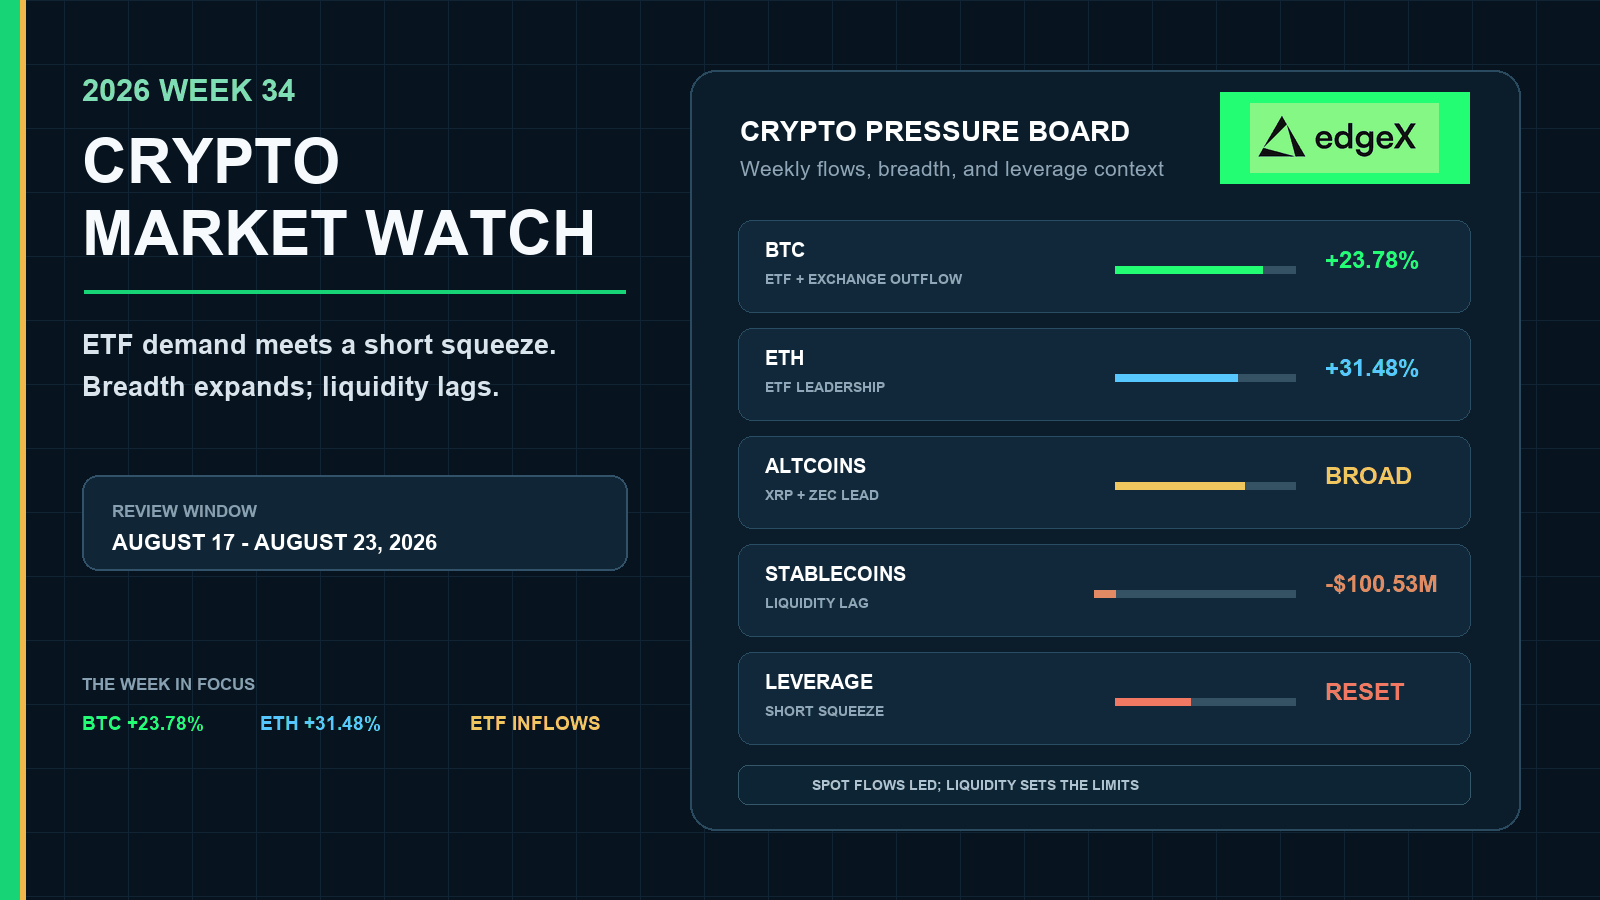
- •Bitcoin rose 23.78% to $77,755.26 and Ether gained 31.48% to $2,463.82 in the August 23 seven-day snapshot, breaking out of Bitcoin's prior $62,000-$66,000 range.
- •The rally's trigger combined Trump's call for Congress to pass the CLARITY Act with a Treasury announcement of significantly increased 20-year and 30-year bond buybacks that pushed long-dated yields lower.
- •Spot Bitcoin ETFs recorded roughly 28,628.93 BTC in five-session net inflows, Ethereum ETFs added about 327,810 ETH, and weekly BTC exchange netflow of -11,308.20 BTC tightened exchange-held supply.
- •Caution signals included a negative weekly stablecoin exchange netflow of approximately $100.53 million and an August 22 Bitcoin deposit spike showing some holders sold into strength.
- •Week 35 (August 24-30) centers on U.S. July PCE inflation, Nvidia's August 26 earnings, and the Jackson Hole Symposium, with sustained gains requiring continued ETF inflows, non-positive BTC exchange netflow, and stablecoin liquidity recovery.
Quick Answer
Crypto broke higher in Week 34 because spot demand and a macro-policy catalyst arrived together. Bitcoin and Ether rose sharply, ETF flows turned strongly positive, BTC left exchanges, and a crowded short side was forced to cover after the U.S. Treasury expanded long-maturity bond buybacks and yields fell. Ether outperformed Bitcoin and several large altcoins delivered even larger gains, showing that the move broadened beyond a single-asset squeeze. The caution is liquidity: stablecoin exchange netflow finished negative, the late-week BTC deposit spike showed that some holders were willing to sell into strength, and derivatives positioning remained large. Week 35 must show whether cash demand can absorb profit-taking after the forced-covering phase fades.
Week 34 Turned a Range Into a Broad Crypto Breakout
The market entered the week with Bitcoin trapped in a roughly $62,000-$66,000 range, according to CNBC's August 20 report. It left that range with a powerful repricing. CoinMarketCap's August 23 historical snapshot recorded BTC at $77,755.26, up 23.78% over seven days, and ETH at $2,463.82, up 31.48%. The figures are the August 23 seven-day snapshot, not a continuously compounded close.
The move was not limited to the two largest assets. XRP gained 53.45%, ZEC 75.34%, HYPE 43.83%, SOL 28.04%, and DOGE 34.45%. Privacy, exchange, and derivatives-linked tokens outpaced BTC as traders moved out on the risk curve.
Ether led the large-cap rotation
ETH/BTC rose from approximately 0.02983 at the August 16 snapshot to 0.03169 on August 23. Ether's 31.48% seven-day gain exceeded Bitcoin's 23.78% gain by 7.70 percentage points. That relative move matters because it shows the breakout was not simply a Bitcoin safe-haven trade. Capital moved into the smart-contract and application layer while the total crypto complex was repriced higher.
Ether also had the stronger ETF impulse in native units. The supplied CoinGlass snapshot shows five-session Ethereum ETF net inflows totaling approximately 327.81K ETH. Bitcoin ETF inflows were positive every session, but the 28.63K BTC result was smaller relative to BTC's market size. One week of inflows cannot establish a durable altseason.
Breadth expanded, but the leaders were high beta
XRP, ZEC, HYPE, DOGE, and SOL all outperformed BTC, while TRX gained only 3.98% and LINK 22.88%. The market rewarded liquidity, narratives, and leverage-sensitive exposure unevenly. The breadth is healthier than a BTC-only advance, yet the largest winners carry higher reversal risk when funding cools.
The test is whether the second tier continues to outperform after the catalyst becomes old news. If BTC consolidates above the prior range while ETH/BTC holds above 0.030, the breakout has a stronger foundation. If only volatile tokens rise, the breadth reading will describe a late-cycle chase.
Flows Confirmed Spot Demand, With a Late Liquidity Warning
The flow data was the clearest difference between Week 34 and the weak, deposit-heavy Week 33. Institutional wrappers bought while BTC left exchanges. That combination tightened available supply at the same time that the macro catalyst increased the price investors were willing to pay.
Bitcoin exchange withdrawals absorbed the rally supply
CryptoQuant's all-exchange BTC netflow readings were +1,982.66 BTC on August 17, -6,864.59 BTC on August 18, -2,012.84 BTC on August 19, -10,046.10 BTC on August 20, +495.29 BTC on August 21, +5,843.45 BTC on August 22, and -706.06 BTC on August 23. The weekly total was -11,308.20 BTC.
The largest withdrawal arrived on August 20, when CNBC reported Bitcoin up about 5.2% and Ether more than 9% after Trump's CLARITY Act comments and the Treasury buyback news. Coins leaving exchanges during a sharp rise are consistent with custody or longer-term positioning, but do not prove accumulation. The August 22 deposit spike shows that profit-taking supply was still active.
ETF demand became the institutional confirmation
The Bitcoin ETF table shows a positive daily sequence: +4.73K BTC on August 17, +2.93K BTC on August 18, +7.99K BTC on August 19, +8.75K BTC on August 20, and +4.21K BTC on August 21. The five-session total was approximately +28,628.93 BTC. Ethereum ETF flows were +16.48K, +37.33K, +97.44K, +97.46K, and +79.10K ETH, totaling +327,810 ETH.
ETF flows are not a perfect proxy for new demand because creations, redemptions, arbitrage, and hedges affect daily figures. Their alignment with price, withdrawals, and Ether's relative strength makes the impulse more credible than a move driven only by perpetual futures.
Stablecoin flows did not fully validate the breakout
All-stablecoin exchange netflow was positive on August 17 (+$285.32M), August 19 (+$365.93M), August 20 (+$31.80M), August 22 (+$24.25M), and August 23 (+$58.62M). It was negative on August 18 (-$36.73M) and August 21 (-$829.73M), producing a weekly balance of approximately -$100.53M.
That pattern is more cautious than the ETF data. Stablecoins moved onto exchanges early, but the large August 21 withdrawal removed more liquidity than the other inflows supplied. The negative weekly balance means the exchange-based dollar buffer did not expand as consistently as ETF demand.
| Week 34 signal | Reading | What it says about the breakout |
| BTC price, August 23 snapshot | $77,755.26; +23.78% 7d | The prior range broke decisively |
| ETH price, August 23 snapshot | $2,463.82; +31.48% 7d | Large-cap leadership broadened |
| ETH/BTC | 0.02983 to 0.03169; +6.2% | Ether gained relative strength |
| BTC ETF net flow | +28,628.93 BTC | Institutional wrapper demand confirmed the move |
| ETH ETF net flow | +327,810 ETH | Ether demand was especially strong in native units |
| BTC exchange netflow | -11,308.20 BTC | Net exchange supply tightened |
| Stablecoin exchange netflow | -$100.53M | Exchange dollar liquidity ended slightly lower |
| BTC dominance, August 23 | About 59.69% | Altcoin gains broadened the rally without erasing BTC leadership |
The Catalyst Was Macro and Policy, Then Leverage Amplified It
The rally's immediate trigger was a policy-and-rates combination rather than a single protocol announcement. On August 20, CNBC reported that Trump urged Congress to pass the CLARITY Act, said sentiment was supported by plans to buy sizable amounts of Bitcoin, and noted that the Treasury had announced a significant increase in 20-year and 30-year bond buybacks. Long-dated yields fell, improving the relative appeal of higher-risk assets. Bitcoin rose about 5.2% in the report and Ether more than 9%.
Lower long-end yields reopened the risk channel
Long-duration Treasury buybacks can reduce perceived supply pressure and pull yields lower. Lower yields reduce the discount rate applied to speculative assets, while a softer dollar can support dollar-priced crypto. If buybacks are interpreted as a response to fiscal stress, volatility can rise instead. Week 34 traders initially chose the risk-on interpretation.
CLARITY Act expectations lifted the regulatory risk premium
Trump's push for the CLARITY Act gave the market a clearer potential path for U.S. digital-asset market structure. Regulatory clarity can lower the risk premium applied to exchanges, stablecoin issuers, token projects, and institutional products. The signal was broad enough to lift HYPE and crypto-related equities, but it remains an expectation until Congress passes legislation. Policy headlines can therefore support price while leaving a large reversal risk if the legislative timetable slips.
Short covering converted a catalyst into a squeeze
CNBC cited Fundstrat's Thomas Lee, who described the recent move as triggering the second-largest short liquidation in history. Search-indexed CoinGlass coverage around August 23 also put a four-hour liquidation burst at about $101.39 million, while other market reports described a much larger multi-day leverage reset. These figures use different windows and should not be added together, but they point to the same mechanism: traders who were short the range had to buy as resistance broke, adding forced demand to ETF and spot buying.
Forced buying can produce a fast overshoot, then disappear once positions are closed. Sustained gains need fresh spot demand, not only a declining short balance.
China Added a Stable, Not Stimulative, Macro Signal
China's August 20 loan-prime-rate fixing provided a relevant regional cross-check. The official China Government release reported the one-year LPR at 3.00% and the five-year LPR at 3.50%, both unchanged for the 15th consecutive month. The CFETS LPR page showed the same 20 August 2026 fixing.
Unchanged LPRs limited the immediate policy impulse
Stable lending benchmarks reduce tightening risk but do not add liquidity. For crypto, the transmission runs through Asian risk appetite, the renminbi-dollar channel, and demand for technology and alternative assets. The decision offered stability rather than a new reason to chase the rally.
China's policy backdrop still matters because it constrains the regional response to a U.S.-led risk move. A steady LPR alongside a stronger dollar or weaker Chinese activity could limit follow-through in Asia even if U.S. crypto ETFs remain positive. Offshore trading activity and Hong Kong's digital-asset market can transmit that divergence into global token liquidity.
China did not cause the breakout; its rates simply did not obstruct the U.S.-led risk-on move.
Derivatives Are the Week 35 Fault Line
Publication-time derivatives data around August 23-24 showed Bitcoin futures open interest near $54.54 billion, down about 2.65% in one report, with major perpetual funding rates close to the 0.01% baseline. The combination suggests some leverage was cleared during the pullback rather than aggressively rebuilt at the highs. It is healthier than a rally accompanied by rapidly accelerating open interest, but it is not a guarantee against another squeeze.
Reports described roughly $250 million of leveraged long liquidations during a later pullback and a $28.90 million Bitcoin liquidation event plus a $32.80 million Ethereum event in an August 23 daily summary. These are window-specific, not one official weekly total. They show that the market had enough leverage for a modest reversal to force meaningful selling even after the short side had been squeezed.
A clean breakout needs open interest to stabilize
If price holds above the former $66,000 resistance while open interest rebuilds gradually and funding remains near neutral, the market can add exposure without recreating the crowded one-way trade. If open interest jumps faster than spot volume, the breakout becomes more dependent on derivatives and more vulnerable to a liquidation cascade.
ETH requires a separate check. Its stronger ETF flow and ETH/BTC move support the bull case, but the 31.48% weekly gain also leaves more profit to protect. A loss of 0.030 in ETH/BTC while ETH open interest rises would be a warning that relative strength is being replaced by leveraged chasing.
Week 35: Can Cash Demand Survive the Squeeze?
The next week runs from August 24-30, 2026. The scheduled catalysts are unusually concentrated. Market calendars identify U.S. July PCE inflation data, Nvidia's earnings on August 26, and the Jackson Hole Symposium later in the week as the main cross-asset events. Their common transmission channel is rates: a hotter PCE print or hawkish Fed communication could lift yields and pressure the high-beta portion of crypto, while softer inflation or a dovish signal could extend the risk-on move.
The constructive path requires three confirmations
First, ETF flows need to remain positive after the five-day impulse, with Bitcoin and Ether creations continuing rather than turning into redemptions. Second, BTC exchange netflow should stay near neutral or negative; a sustained return to deposits would show that rally supply is arriving faster than demand. Third, stablecoin exchange balances need to stop contracting. A positive stablecoin netflow week would give the market a larger cash buffer to absorb profit-taking.
The price and breadth test is equally important. BTC above the former $66,000 ceiling, ETH/BTC above 0.030, and positive large-cap breadth would support a self-sustaining recovery. If only ZEC, HYPE, or other high-beta names lead, reversal risk rises.
The downside path begins with rates or liquidity
A hotter-than-expected PCE reading, a hawkish Jackson Hole message, or disappointing Nvidia guidance could reverse the Treasury-yield impulse. The first mechanical warning would be BTC returning through the former breakout zone while open interest rises and funding turns crowded. A negative stablecoin-flow week would make that move easier to accelerate because fewer exchange-held dollars would be available to meet forced selling.
China's unchanged LPRs leave regional policy steady but not expansionary. If Asian risk appetite lags the U.S. move, crypto may rely too heavily on U.S. ETF demand and derivatives, raising the cost of a macro disappointment.
The decision criterion for Week 35 is therefore not a new price target. It is whether spot flows, exchange balances, stablecoin liquidity, and breadth confirm the breakout after short covering has passed. If they do, the market can digest gains. If they do not, the same leverage that accelerated Week 34 can reverse it.
Trade Crypto With Leverage - Without Giving Up Custody
Decentralized perpetual exchanges have moved well past niche status. According to CoinGecko's 2025 Annual Crypto Report, DEX perpetual trading volume surged 346% last year, reaching $6.7 trillion, while centralized exchange open interest fell 20.8% over the same period. Traders are committing serious capital to on-chain derivatives, and the reasons are straightforward: counterparty risk is real, custodial failures happen, and censorship resistance matters.
edgeX is a decentralized perpetual futures exchange built for traders who want market access without sacrificing control. Here's what sets it apart:
- No KYC, no barriers. Connect a wallet and start trading. No identity verification or account approvals are required.
- True self-custody. edgeX combines off-chain order matching with verifiable on-chain settlement secured by Ethereum. Forced-withdrawal mechanisms keep funds recoverable directly from the blockchain even if the operator goes offline.
- Deep liquidity, tight spreads. edgeX maintains $10 million of market depth within a one-basis-point spread, with sub-0.1-basis-point slippage on trades exceeding $100,000.
- Up to 100x leverage. Traders can scale positions to match their risk framework, whether hedging exposure or trading momentum.
- 140% trading fee rewards. Active traders can earn rewards on their trading activity, reducing the net cost of frequent strategies.
- Institutional-grade infrastructure. edgeX processes up to 200,000 orders per second with matching latency below 10 milliseconds.
Start trading crypto perpetual futures on edgeX and put your market view to work.
Frequently Asked Questions
What dates does the Week 34 Crypto Market Watch cover?
The review covers August 17-23, 2026, using UTC dates. Week 35 refers to August 24-30, 2026.
Why did crypto rally in Week 34?
The rally combined strong Bitcoin and Ether ETF inflows, BTC exchange withdrawals, lower long-dated Treasury yields after expanded buybacks, Trump's CLARITY Act push, and forced short covering after resistance broke.
Did Ether outperform Bitcoin?
Yes. ETH rose 31.48% in the August 23 snapshot versus Bitcoin's 23.78%, and ETH/BTC gained about 6.2% to approximately 0.03169.
What did the ETF data show?
Bitcoin spot ETFs added approximately 28,628.93 BTC across August 17-21. Ethereum spot ETFs added approximately 327,810 ETH over the same trading days.
Did exchange flows confirm accumulation?
BTC exchange netflow was negative by approximately 11,308.20 BTC for the week, which reduced exchange-held supply. Netflow alone does not prove that every withdrawal was long-term accumulation.
What should traders watch in Week 35?
Watch whether ETF inflows remain positive, BTC exchange netflow stays near withdrawals, stablecoin liquidity recovers, ETH/BTC holds above 0.030, and leverage remains orderly around the PCE, Nvidia, and Jackson Hole catalysts.

