2026 Week 30 Stocks Market Watch: AI Capex, Oil Shock, Yields, and Earnings Rotation
Key Takeaways
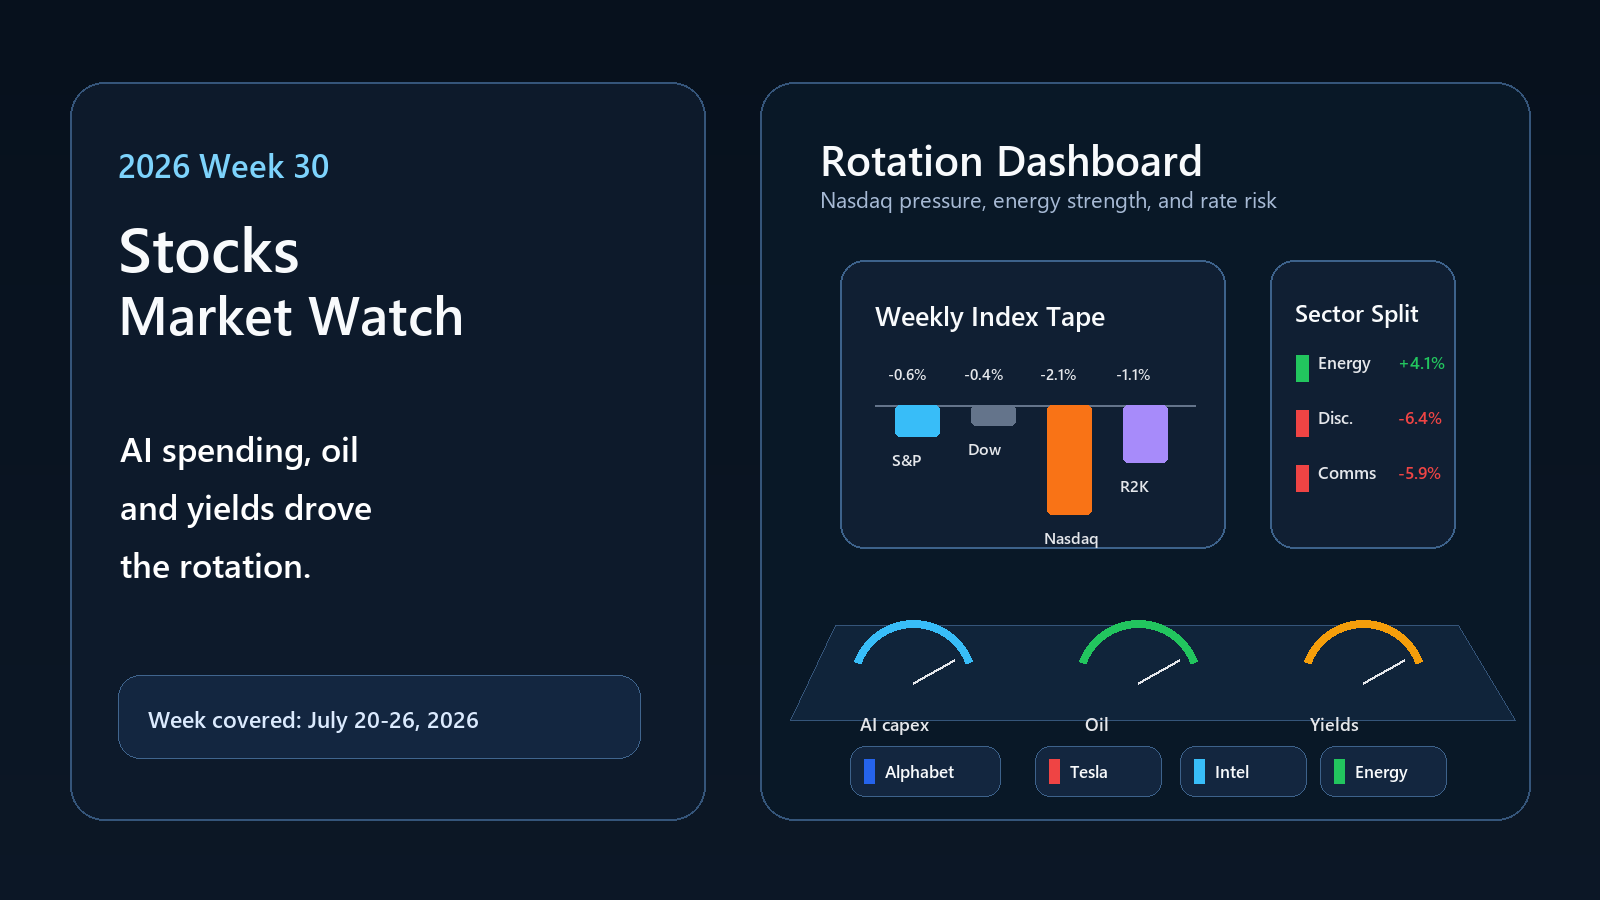
- •The Nasdaq Composite fell 2.1% for the week, reflecting heavier pressure on technology and AI-linked growth stocks.
- •LPL’s sector snapshot showed energy gained 4.07%, while consumer discretionary dropped 6.38% and communication services lost 5.90%.
- •AP reported Brent crude at $96.78 on July 24 after it had climbed above $102 the previous day.
- •Investors scrutinized AI capital expenditure, margins, guidance and monetization timelines during earnings season.
- •The article said the week looked more like sector rotation than a broad equity-market liquidation.
Why Week 30 Mattered for Stocks
Week 30 was the kind of market week that looked simple on an index table and much more complicated underneath. The S&P 500’s weekly decline was moderate. The Dow slipped only slightly. The Russell 2000 lost ground but did not become the center of stress. The real pressure sat in the Nasdaq and in the parts of the market most exposed to AI expectations, mega-cap earnings, consumer cyclicality, and duration-sensitive valuation.
That makes the week useful for investors because it separated two questions that often get blended together. One question is whether the economy was breaking. The evidence did not point to a clean break. Another question is whether the market had paid too much for future growth in a world where oil, yields, and capital spending were all rising. That question became harder to dismiss.
Reuters reported that Thursday’s selloff came as large technology earnings revived concern about heavy AI spending, while oil hit $100 and lifted inflation worries. AP’s Friday recap then showed a calmer close, but not a full recovery: all four major U.S. indexes still ended the week lower. The market stabilized at the surface, but the leadership problem remained.
A rotation week, not a panic week
The most important distinction is that Week 30 was a rotation week rather than a full risk liquidation. If investors had been dumping everything, energy, utilities, industrials, materials, health care, and real estate would not have shown the same relative resilience captured in LPL’s weekly performance table. The market was not saying every equity story was broken. It was saying the price of certain stories had become more difficult to defend.
That is why the Nasdaq’s underperformance mattered. Technology and communication services had carried a large share of the rally’s narrative power. When those areas weaken while energy rises, the market is sending a message about inflation, capital intensity, and valuation discipline. It is not rejecting equities outright. It is changing what kind of equity exposure it wants to own.
Week 30 Stock-Market Dashboard
| Market Signal | Week 30 Read |
|---|---|
| S&P 500 | Down 0.6% for the week, according to AP’s July 24 index recap. |
| Nasdaq Composite | Down 2.1%, showing heavier pressure in technology and AI-linked growth. |
| Dow Jones Industrial Average | Down 0.4%, outperforming the Nasdaq but still negative. |
| Russell 2000 | Down 1.1%, showing small-cap pressure but not the main leadership shock. |
| Energy sector | Up 4.07% for the week in LPL’s sector table as oil risk supported the group. |
| Consumer discretionary | Down 6.38%, the weakest sector in LPL’s weekly snapshot. |
| Communication services | Down 5.90%, reflecting pressure tied to mega-cap earnings and AI spending concerns. |
| Brent crude | AP reported Brent at $96.78 on July 24 after a spike above $102 the prior day. |
The dashboard shows why the week cannot be reduced to “stocks fell.” Energy strength says inflation and supply risk mattered. Nasdaq weakness says valuation and AI capex mattered. Consumer discretionary weakness says the market was less comfortable with expensive consumer-growth exposure. Communication services weakness says earnings quality and spending plans were under scrutiny.
The more subtle signal was that market stress moved through several channels at once. Oil raised the inflation tail. Yields stayed high enough to pressure duration. Earnings forced investors to inspect AI spending more closely. Tariff headlines added another layer of cost concern. Any one of those might have been manageable. Together, they turned a growth-led market into a rotation tape.
AI Spending Became the Valuation Problem
The AI trade did not break in Week 30, but it became less automatic. Investors began treating AI capital expenditure as a real line item rather than a vague promise of future productivity. That is a meaningful shift. When money is cheap and revenue momentum is obvious, markets often reward investment. When yields are elevated and inflation risk is visible, the same investment can look like a margin question.
Alphabet and Tesla helped frame the debate because their earnings reactions made investors less willing to treat mega-cap growth as invincible. The problem was not simply whether individual companies missed a number. The broader issue was whether the market had become too comfortable assuming that AI spending would always translate into shareholder value quickly enough.
Capex can help suppliers and hurt buyers
AI infrastructure spending is complicated for equities because it creates winners and losers at the same time. Higher data-center budgets can support chipmakers, memory suppliers, networking firms, power equipment, utilities, and construction-linked businesses. But the companies writing the checks still have to prove those checks produce enough revenue, productivity, or customer retention.
That split helps explain why some chip and infrastructure names could avoid the worst of the damage while platform companies faced more scrutiny. The market was not saying AI demand had disappeared. It was asking whether the economics were spreading evenly, and whether the largest buyers were getting paid back fast enough.
Oil and Yields Turned the Macro Backdrop Less Forgiving
Oil was the second major pressure point. AP reported that Brent crude fell nearly 4% to $96.78 on July 24 after spiking above $102 the previous day. Reuters described oil's surge as an inflation risk that helped keep global bond yields under pressure. For equities, that combination matters because oil does not only affect energy stocks. It affects transport costs, consumer spending power, inflation expectations, and the Fed reaction function.
Higher oil can be good for energy producers and bad for many other sectors. It can help explain why energy led the week while consumer discretionary suffered. If investors think fuel costs, shipping costs, and headline inflation are rising, they become less generous toward companies that need strong household spending or stable margins.
Yields made that trade harder. Rising or elevated bond yields reduce the market's tolerance for distant growth because future earnings are discounted more heavily. That is why technology and other long-duration sectors can sell off even when the economy is not collapsing. The valuation math changes before the earnings story fully changes.
Earnings Created Dispersion Instead of Comfort
Week 30 sat inside earnings season, which means the market had company-level evidence rather than only macro speculation. That should have helped if the results were strong enough and guidance was clean enough. Instead, earnings created dispersion. Some companies could reassure investors. Others made the market more nervous about spending, margins, demand, or valuation.
Intel offered a useful contrast late in the week, with reports pointing to a stronger outlook and AI chip demand. That kind of result helped parts of the semiconductor complex. But one supportive chip story could not fully offset broader concern about whether mega-cap platforms were spending too heavily and whether consumer-facing growth was becoming more fragile.
This is what earnings season often does after a long rally. It turns themes into numbers. AI becomes capex, cloud revenue, margins, depreciation, and guidance. Consumer strength becomes sales, credit quality, transaction volume, and pricing power. Inflation becomes input costs, fuel, wages, and gross margin. Week 30 forced investors to look at the details.
Guidance mattered more than the beat
The market reaction suggested that a headline earnings beat was not enough. Investors wanted confidence about the next several quarters. They wanted to know whether spending plans were disciplined, whether margins could hold, and whether management teams were seeing demand that justified high valuations.
That is an important late-cycle behavior. When expectations are low, companies can rally on relief. When expectations are high, companies need to remove doubt. Week 30 showed that AI-linked and consumer-growth stocks had less room for vague answers.
Sector Rotation Told the Cleaner Story
The weekly sector split was more revealing than the index move. LPL's snapshot showed energy as the clear winner, up 4.07%, while consumer discretionary fell 6.38% and communication services lost 5.90%. Utilities, industrials, real estate, materials, and health care also posted gains in that table, showing investors were willing to own equities with different risk profiles.
That is not a classic broad-market breakdown. It is a change in leadership. Energy strength reflected oil and inflation risk. Utilities and real estate resilience suggested some defensive and rate-sensitive demand. Industrials and materials strength pointed to selective cyclicality rather than total growth fear.
For traders, the message was to stop treating “stocks” as one trade. A Nasdaq-heavy portfolio felt very different from an energy-and-industrials portfolio. A consumer-discretionary basket felt very different from a utilities basket. Week 30 rewarded sector awareness more than index-level confidence.
Market Impact Map
The bullish interpretation is that Week 30 was a necessary reset. AI expectations had become crowded, oil risk had shocked the market, and earnings season forced more discipline. If yields stabilize and upcoming mega-cap earnings prove that AI spending is translating into durable revenue, the pullback can become a healthier base.
The bearish interpretation is that the market is discovering a more expensive growth model. If AI capex keeps rising, oil remains elevated, tariffs add cost pressure, and yields refuse to fall, valuations may need more than a one-week adjustment. In that version, the Nasdaq remains vulnerable even if the broader economy avoids a recession.
| Driver | Stock-Market Impact | What Traders Watched |
|---|---|---|
| AI capex concern | Pressured mega-cap growth and communication services | Cloud spending, data-center budgets, margins, and monetization timelines |
| Oil spike | Supported energy but raised inflation and margin risk | Brent crude, transport costs, consumer pressure, and energy earnings |
| Elevated yields | Reduced tolerance for long-duration valuation | Treasury yields, Fed expectations, and growth-stock multiples |
| Earnings dispersion | Separated companies with proof from companies priced for perfection | Guidance, margins, demand commentary, and capital allocation |
| Sector rotation | Favored energy and selected defensives over consumer-growth exposure | Breadth, sector leadership, and index concentration |
| Tariff headlines | Added another possible cost and inflation channel | Import-sensitive sectors, margins, and policy uncertainty |
What Traders Should Watch Next
The next test is whether the market can turn rotation into stabilization. If energy cools without damaging demand, yields settle, and Big Tech earnings offer better AI monetization evidence, Week 30 may look like a valuation reset rather than the start of a deeper correction. If oil stays volatile, yields stay high, and capex guidance keeps rising faster than revenue confidence, the Nasdaq may struggle to regain leadership.
Breadth is the key signal. A recovery led only by one or two mega-cap names would not fully repair the week. A broader recovery across semiconductors, software, industrials, financials, selected consumer names, and small caps would tell a stronger story. The market needs more than relief. It needs proof that earnings and margins can carry valuations through a less forgiving macro backdrop.
For equity-linked RWA traders, Week 30 also reinforced a practical point: stock narratives move faster than traditional market hours. Oil headlines, earnings calls, futures reactions, and AI capex commentary can reshape exposure before the next cash session opens. That is why always-on liquidity, self-custody, and fast execution are becoming part of the stock-trading conversation.
Trade Stocks Without the TradFi Gatekeeping
The stock market moves fast. Your trading infrastructure should too.
As RWA markets mature and tokenized stocks become a serious alternative to tradFi access points, more traders are asking the same question: why settle for a centralized platform that controls your assets, demands KYC, and keeps your trading fees?
edgeX Exchange offers a different answer. Built on EDGE chain and settling on Ethereum via Arbitrum, edgeX is a decentralized perpetual futures platform where you can trade stocks with high leverage without handing over your identity or your keys.
Here’s what sets it apart:
- True self-custody: Users control their private keys at all times. Withdrawals require no platform approval.
- Institutional-grade liquidity: $10 million depth within a one-basis-point spread, with sub-0.1-basis-point slippage on trades over $100,000.
- CEX-level speed: The order book processes up to 200,000 orders per second with sub-10 millisecond matching latency.
- No KYC required: Sign up and start trading without the friction of traditional onboarding.
- 100% trading fee rewards: Every fee you pay comes back to you through the Trade to Own program.
- USDC-backed settlement: USDC is designed by Circle to be redeemable 1:1 for U.S. dollars, giving traders a familiar stablecoin base.
Whether you’re rotating out of tradFi equities, exploring RWA perpetuals, or simply looking for a smarter way to trade stocks on-chain, edgeX delivers the execution quality of a top-tier exchange with the security guarantees of decentralized infrastructure.
Available on iOS and Android, edgeX is built so your edge goes wherever you do. Start trading on edgeX.
Frequently Asked Questions
What was the main stock-market story in Week 30 of 2026?
The main story was a rotation away from crowded AI and growth exposure as oil, yields, tariffs, and earnings concerns made valuation risk harder to ignore.
How did major U.S. indexes perform in Week 30?
AP reported that the S&P 500 fell 0.6%, the Dow lost 0.4%, the Nasdaq dropped 2.1%, and the Russell 2000 declined 1.1% for the week ended July 24.
Why did the Nasdaq underperform?
The Nasdaq underperformed because investors became more cautious on technology and AI-linked shares, especially as earnings revived questions about heavy AI spending and future returns.
Why did energy outperform?
Energy outperformed because oil risk stayed elevated. LPL Research's weekly sector table showed energy up 4.07%, while several growth-linked sectors fell sharply.
What should traders watch after Week 30?
Traders should watch whether yields stabilize, oil cools, Big Tech earnings support AI monetization, and market breadth improves beyond a few mega-cap leaders.

