2026 Week 30 Commodities Market Watch: Oil Spike, Metals Gains, Gas Weakness, and Inflation Risk
Key Takeaways
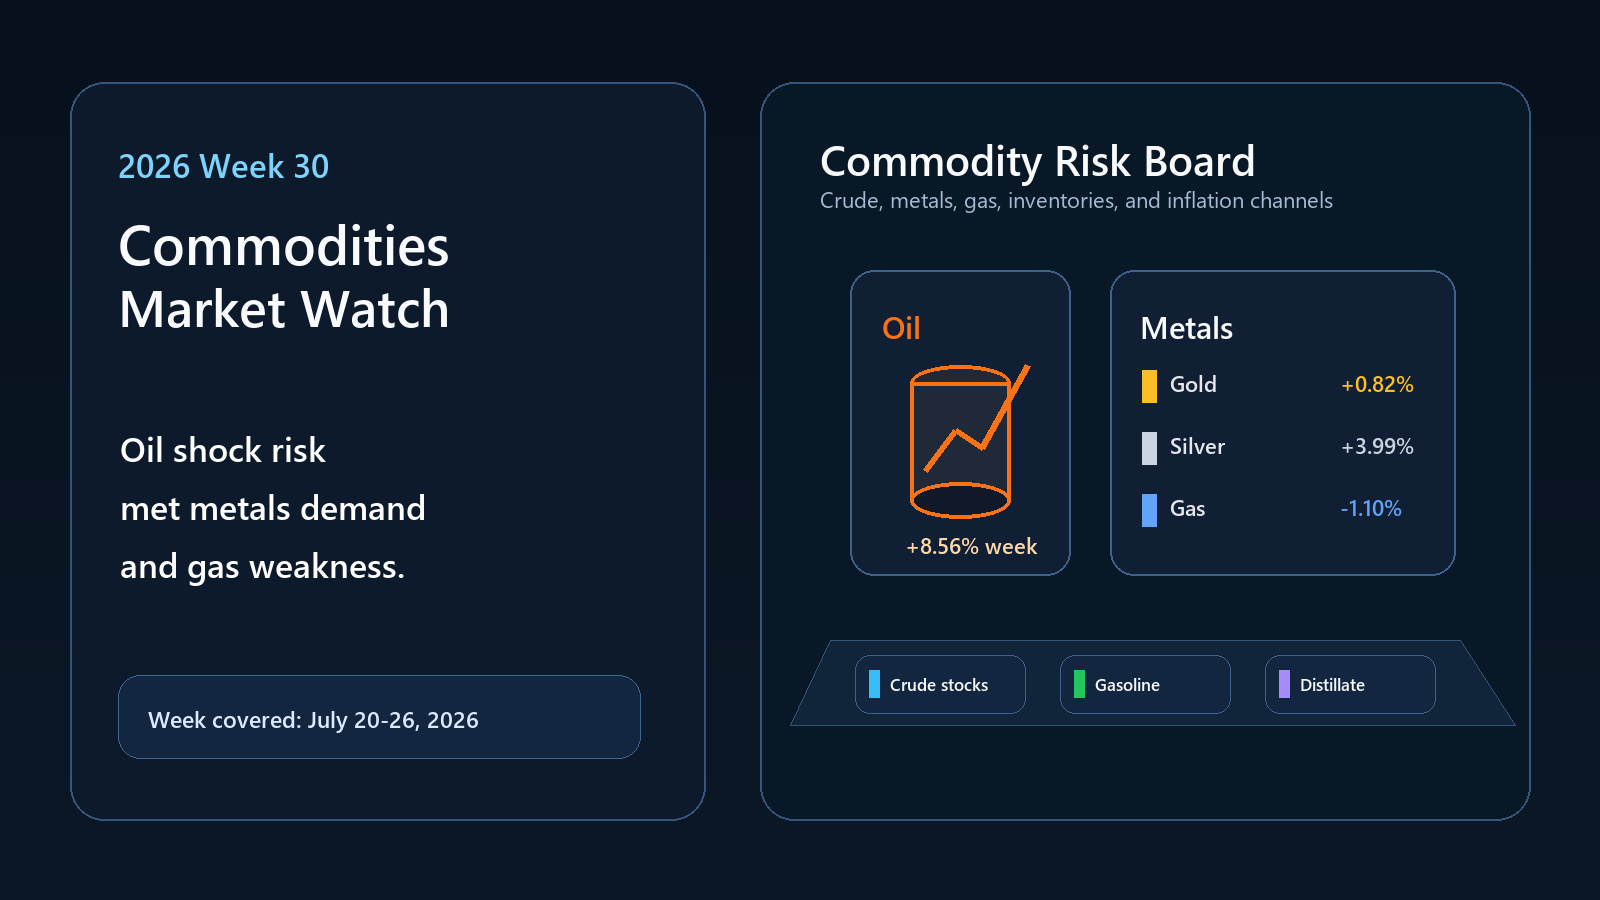
- •Oil rose 8.56% for the week as geopolitical risks lifted the premium for potential supply disruption.
- •Brent crude pulled back to $96.78 on July 24 after briefly trading above $100 amid Middle East and Red Sea concerns.
- •U.S. commercial crude inventories increased by 2.0 million barrels to 411.7 million barrels for the week ending July 17.
- •Gold gained 0.82% and silver rose 3.99%, showing stronger demand for higher-beta metals than for a broad haven trade.
- •Natural gas fell 1.10%, underscoring that Week 30 was not a universal energy rally.
Why Week 30 Mattered for Commodities
Week 30 mattered because commodities stopped being a side story and became the market's inflation transmission mechanism again. The prior weeks had already shown that oil could react violently to geopolitics. Week 30 showed what happens when that move arrives alongside elevated yields, AI-spending worries in equities, and renewed concern that inflation might not stay contained.
The commodity tape was not simple. Oil surged and then backed off. Gold rose, but not like a panic hedge. Silver outperformed gold, suggesting industrial and speculative demand still mattered. Natural gas fell despite the broader commodity lift. That divergence is important because it tells traders not to treat “commodities” as a single macro bet.
The better way to read the week is by function. Oil was the supply-shock asset. Gold was the rate-sensitive hedge. Silver sat between precious metal and industrial metal. Natural gas remained a weather, storage, and regional-demand trade. Each market gave a different answer to the same question: is the world facing demand strength, supply disruption, or financial-condition stress?
The week was a supply-premium test
The strongest signal came from crude. AP reported Brent above $100 on July 23 as fighting in the Middle East and attacks on Saudi oil tankers in the Red Sea threatened global supply routes. By July 24, Brent had fallen nearly 4% to $96.78, but the weekly gain remained large enough to matter.
That pullback did not erase the message. It showed that oil traders were willing to price a geopolitical premium but also quick to reduce it when peace-talk hopes or de-escalation headlines appeared. In other words, Week 30 was not a stable demand boom. It was a volatile supply-risk auction.
The reaction also showed why crude can matter more than its own chart. Once Brent moved through the psychological $100 area, traders had to think about airline margins, freight costs, consumer gasoline expectations, emerging-market import bills, and the inflation assumptions embedded in bond yields. That made the oil move bigger than an energy-desk event. It became a test of whether a summer disinflation narrative could survive a new supply premium.
Week 30 Commodities Dashboard
| Market Signal | Week 30 Read |
|---|---|
| Oil | Up 8.56% for the week in LPL's July 24 performance table. |
| Brent crude | AP reported Brent at $96.78 on July 24 after a spike above $102 the previous day. |
| Gold | Up 0.82% for the week, supported but not explosive. |
| Silver | Up 3.99%, outperforming gold and keeping the metals story more cyclical. |
| Natural gas | Down 1.10%, showing that gas fundamentals diverged from crude and metals. |
| EIA crude inventories | Commercial crude stocks rose 2.0 million barrels to 411.7 million barrels for the week ending July 17. |
| Product inventories | Gasoline rose 0.8 million barrels and distillate rose 1.4 million barrels, but both stayed below five-year averages. |
| Refinery utilization | EIA reported refineries operating at 96.1% capacity utilization. |
The dashboard shows a commodity market defined by divergence. Oil rose because supply risk mattered. Metals rose, but in a more measured way. Natural gas fell, rejecting the idea that every energy contract had to follow crude. Petroleum inventories built, yet the market still paid up for oil risk because below-average stock levels and shipping uncertainty made the build less comforting.
That mixed dashboard is the reason Week 30 should not be read as a simple inflation-hedge rally. If traders were buying every commodity for the same reason, natural gas would have looked stronger and gold might have behaved more aggressively. Instead, the market was selective. It rewarded crude for disruption risk, silver for higher-beta metals exposure, and energy-linked equities for direct price leverage, while keeping pressure on contracts whose local fundamentals were less supportive.
Oil Took the Inflation Microphone
Oil dominated Week 30 because it touched almost every other market. Higher crude can lift energy shares, squeeze airlines and transport companies, raise consumer fuel costs, complicate inflation expectations, and make central banks less relaxed about easing. That is why AP's July 23 report tied Brent's move above $100 to broader equity weakness and higher rate-hike anxiety.
LPL’s weekly commentary made the same connection from the market-performance side. It said rising geopolitical tensions in the Middle East pushed oil prices higher and revived concern about energy-driven inflation. In fixed income, LPL noted that the oil resurgence pressured bonds and helped push yields near notable highs.
Inventories did not fully validate the rally
The EIA report gave traders a useful reality check. For the week ending July 17, commercial crude inventories increased 2.0 million barrels to 411.7 million barrels. Gasoline inventories rose 0.8 million barrels, and distillate inventories rose 1.4 million barrels. Total commercial petroleum inventories increased by 11.6 million barrels.
That is not the kind of report that screams immediate shortage. But it did not kill the oil move either. Crude stocks were still 6% below the previous five-year average, gasoline was 7% below, and distillates were 10% below. Refineries were running hard at 96.1% utilization. The physical market was not empty, but it was not loose enough to make a shipping shock irrelevant.
This is the right reading: Week 30 oil strength was not about one inventory line. It was about the market paying for disruption insurance in a system that did not have a huge cushion.
That matters for the next read-through. If inventories keep building while geopolitical headlines calm, oil can lose altitude quickly because the insurance premium becomes harder to defend. If inventories build but shipping risk worsens, the market may ignore the build again. For crude traders, the inventory number was not a verdict. It was a stress test against the geopolitical narrative.
Gold Rose, But the Safe-Haven Story Was Restrained
Gold’s 0.82% weekly gain was positive, but it was not the kind of move that would normally scream panic. That restraint matters. A clean geopolitical shock can drive gold higher, but gold also has to deal with real yields, the dollar, central-bank expectations, and investor positioning. If energy prices lift inflation expectations and yields at the same time, gold can receive safe-haven demand while still facing a higher opportunity cost.
That is the reason gold’s move was useful rather than spectacular. It told traders that protection demand existed, but the rates backdrop still mattered. In a week when oil pushed inflation fears back into focus, gold did not get a free pass.
Silver’s 3.99% gain added a different signal. Silver can behave like a precious metal, but it also carries industrial-demand sensitivity. Its outperformance versus gold suggested that traders were not only buying fear. They were also willing to hold a more cyclical metals expression, at least for the week.
Metals were not one trade
Gold and silver both gained, but they did not say the same thing. Gold was the hedge that rose modestly. Silver was the higher-beta metal that moved more strongly. Copper did not dominate the week, but industrial metals still mattered because they helped traders judge whether the commodity move was broad demand or narrow energy shock.
That distinction matters for portfolio interpretation. If metals rise with oil because global demand is strengthening, cyclicals and emerging markets can benefit. If oil rises mostly from supply fear while gold barely moves and gas falls, the story is more about inflation risk than synchronized demand.
The metals message therefore sat between optimism and caution. Silver's outperformance made the week look less defensive than a pure oil shock. Gold's restrained move made it hard to call the week a broad safety trade. Without stronger copper confirmation, the metals complex did not fully validate a global demand upswing. It told traders to keep watching China, manufacturing data, and real yields before treating metals strength as a durable macro signal.
Natural Gas Refused the Broad Commodity Script
Natural gas was the reminder that energy is not one market. LPL’s table showed natural gas down 1.10% for the week even as oil rallied sharply. That divergence matters because crude and gas respond to different storage, weather, export, infrastructure, and regional-demand dynamics.
For commodity traders, gas weakness prevented the week from becoming a simple “energy up” story. Oil was being priced through geopolitical supply routes and global transport risk. Natural gas was not. That tells readers that the market was not blindly buying every inflation hedge. It was choosing the contracts with the clearest catalyst.
This divergence also matters for equities and macro. Oil has a direct global inflation channel because it feeds gasoline, diesel, jet fuel, freight, and petrochemical costs. Natural gas can also matter for inflation, especially through power and heating, but its regional structure makes the signal less universal. In Week 30, crude carried the global message.
That made natural gas useful precisely because it disagreed. A falling gas price kept the commodity tape from becoming one-directional and reminded traders that energy contracts are not interchangeable. Crude is global, liquid, and directly connected to transport fuels. Gas is more regional and more sensitive to storage, weather, LNG flows, and power demand. The gap between the two helped define Week 30 as a crude-specific shock rather than a universal energy shortage.
Cross-Commodity Impact Map
The cleanest bullish commodity interpretation is that Week 30 confirmed real scarcity risk. Oil gained despite an inventory build because shipping routes were vulnerable and stock cushions were below normal. Silver outperformed gold because traders still saw enough industrial demand to own cyclical metals. Energy equities outperformed because the market rewarded direct crude exposure.
The more cautious interpretation is that the move was fragile. Oil’s Friday pullback showed how quickly the supply premium could fade if diplomacy improved. Inventory builds showed that the physical market was not uniformly tight. Gold’s modest gain suggested that the safe-haven bid was not overwhelming. Natural gas weakness showed that broad commodity demand was not carrying every contract.
| Driver | Commodity Impact | What Traders Watched |
|---|---|---|
| Middle East supply risk | Lifted crude and energy-linked inflation concern | Brent, WTI, Red Sea shipping, Strait of Hormuz flows |
| EIA inventory build | Added nuance to the oil rally | Crude stocks, gasoline, distillates, refinery utilization |
| Below-average petroleum stocks | Kept the supply-risk premium alive | Five-year average comparisons and product demand |
| Gold’s measured gain | Showed hedge demand but not a panic bid | Real yields, dollar, Fed expectations, technical levels |
| Silver outperformance | Kept a cyclical metals signal in play | Industrial demand, risk appetite, and precious-metals positioning |
| Natural gas weakness | Broke the “all energy up” narrative | Weather, storage, regional demand, and export expectations |
What Traders Should Watch Next
The next test is whether oil holds the risk premium after the first shock. If Brent stays elevated while inventories continue building, the market is saying geopolitics still owns the tape. If crude keeps falling as de-escalation headlines improve, the Week 30 rally may look more like a temporary supply-scare spike than the start of a sustained shortage cycle.
Metals need confirmation from both directions. Gold needs lower real yields or stronger hedge demand to extend the move. Silver needs industrial demand to remain firm enough to justify its higher-beta behavior. Copper and other industrial metals will become more important if traders shift from supply shock to global growth analysis.
For cross-asset traders, the biggest question is whether commodity strength becomes an inflation problem. Oil at the center of the market can lift energy producers, but it can also tighten financial conditions through yields and household costs. Week 30’s message was not that commodities were universally bullish. It was that supply risk had regained the power to move everything else.
Trade Commodities Perpetuals On-Chain with edgeX
Commodity markets move fast. Your trading infrastructure should too.
edgeX is a decentralized exchange built on EDGE chain, settling on Ethereum via Arbitrum, that lets traders access tokenized RWA commodities perpetuals with institutional-grade execution and true self-custody. No KYC. No centralized custodian. Just full control of your assets, your private keys, and your positions.
Why traders choose edgeX for commodities:
Ultra-deep liquidity: $10 million of depth within a one-basis-point spread, with sub-0.1-basis-point slippage on trades over $100,000, even during peak volatility.
High-performance engine: Up to 200,000 orders per second with sub-10 millisecond matching latency.
True self-custody: Withdrawals require only your wallet authorization; no platform approval needed.
No KYC required: Start trading commodities, tokenized stocks, and crypto perpetuals without identity verification.
100% trading fee rewards: edgeX's Trade to Own program returns 100% of trading fees back to users in $EDGE tokens.
USDC-backed settlement: USDC is designed by Circle to be redeemable 1:1 for U.S. dollars, giving traders a familiar settlement base.
Whether you’re trading gold, oil, or other RWA commodities, edgeX gives you the liquidity depth of a centralized exchange with the security of on-chain settlement.
The platform is available on desktop and as a native mobile app on iOS and Android, so you can manage positions and react to commodity market moves from anywhere.
Ready to trade commodities perpetuals without the constraints of a centralized exchange? Start trading on edgeX with no KYC and no compromises.
Frequently Asked Questions
What was the biggest commodities story in Week 30 of 2026?
Oil was the biggest story. Brent briefly moved above $100 as Middle East conflict and Red Sea shipping risk revived supply-disruption fears, even though prices pulled back by the end of the week.
Did the EIA report support the oil rally?
Not cleanly. EIA data showed U.S. commercial crude inventories rose 2.0 million barrels for the week ending July 17. However, crude, gasoline, and distillate stocks remained below five-year averages, so the inventory build did not remove supply-risk anxiety.
Why did gold rise only modestly?
Gold rose 0.82% for the week, but higher yields and inflation concerns limited the safe-haven effect. Gold was supported, but not enough to become the dominant commodity story.
Why did silver outperform gold?
Silver gained 3.99%, suggesting traders were willing to hold a more cyclical metals expression. Silver can benefit from precious-metal demand and industrial-demand expectations at the same time.
Why did natural gas fall while oil rose?
Natural gas fell because it follows different fundamentals from crude, including weather, storage, regional demand, and export constraints. Week 30 was an oil supply-risk story, not a blanket energy rally.

