2026 Week 29 Crypto Market Watch: ETH Outperforms Bitcoin as Market Cap Rebounds, but BTC Dominance Rises
Key Takeaways
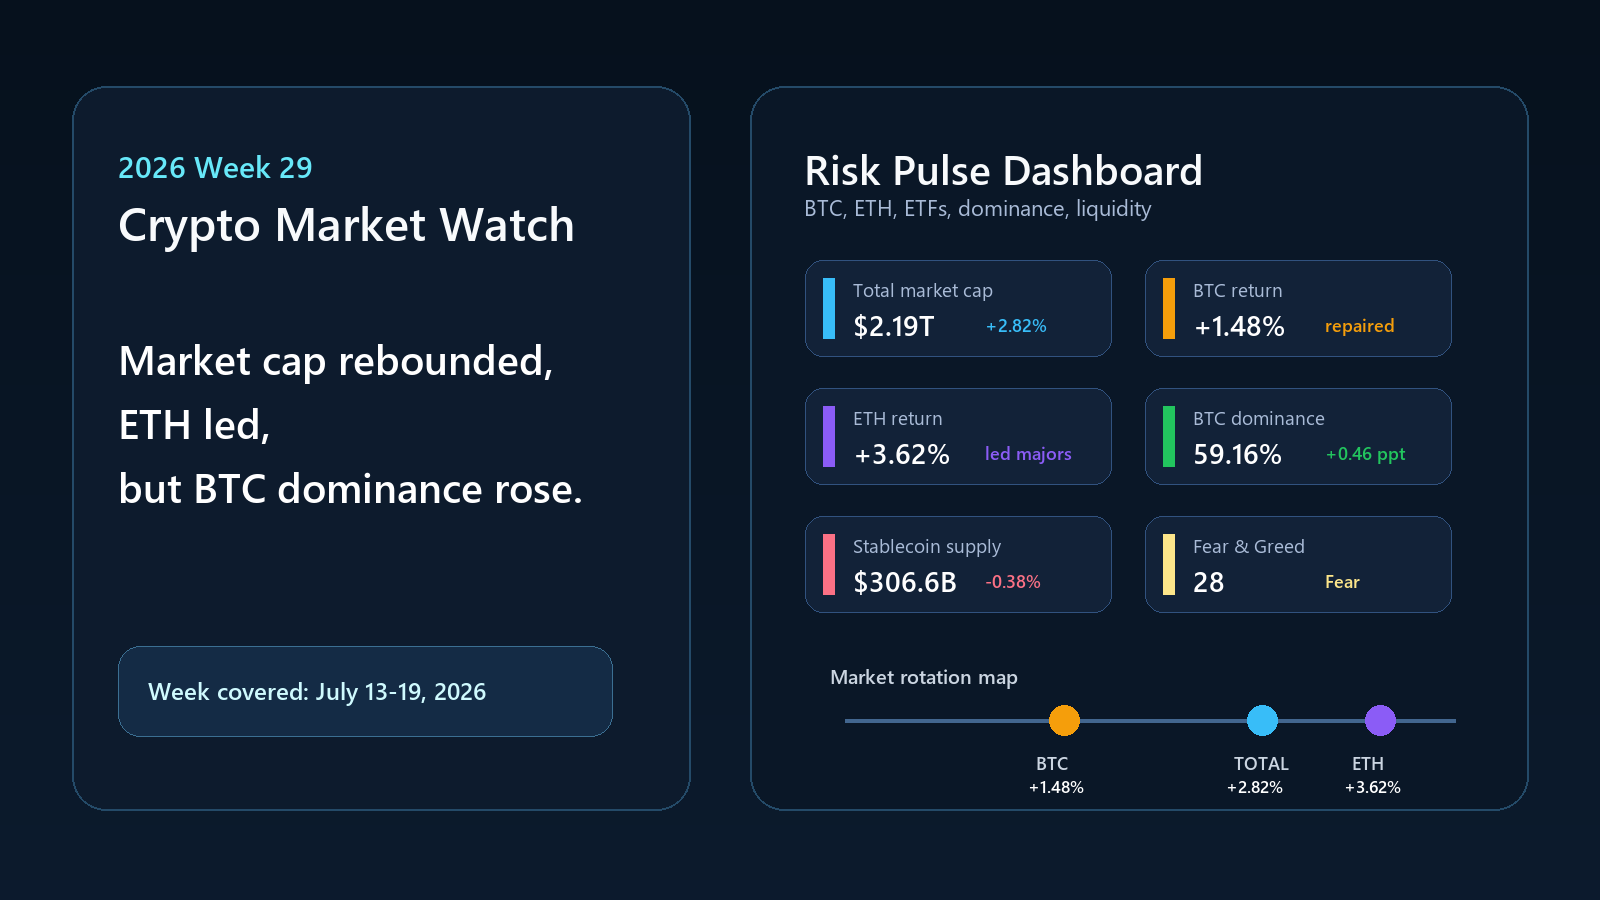
- •Total crypto market capitalization rose from about $2.13 trillion to about $2.19 trillion in Week 29, a weekly gain of 2.82%.
- •ETH gained 3.62% and outperformed BTC, which rose 1.48%, while ETH/BTC improved by about 2.11%.
- •Spot Bitcoin ETFs recorded about 1.20K BTC in net inflows, while Ethereum ETFs saw about 57.88K ETH in net inflows over the five-day U.S. trading window.
- •Market sentiment remained cautious, with the Crypto Fear & Greed Index staying in fear at 28 at both the start and end of the week.
- •Stablecoin supply declined 0.38% during the week, and rising Bitcoin dominance showed that the rebound was selective rather than broad-based.
Week 29 Crypto Market Landscape
Week 29 looked more constructive than the previous week because the move in market capitalization finally carried some weight. TradingView TOTAL hover values showed total crypto market capitalization rising from about $2.13T at the July 13 close to about $2.19T at the July 19 close. The 2.82% weekly gain does not represent a full-cycle reset, but it was clearly better than the sideways stabilization seen a week earlier.
The improvement came while market sentiment remained cautious. The Crypto Fear & Greed Index opened the week at 28, closed at 28, and stood at 29 in the publication-time snapshot on July 20. All three readings were classified as fear. In other words, price repaired faster than confidence.
That matters for interpretation. When markets rise while sentiment is still fearful, they may be in the early stage of repair, but the move may also be a narrow rebound driven by positioning, ETF demand, and short-term relief. Week 29 offered evidence for both readings. ETH outperformed BTC, ETF flows improved, and total market capitalization rose. At the same time, Bitcoin dominance increased and stablecoin supply contracted, making this rally harder to describe as a broad speculative expansion.
CoinGecko’s July 20 global snapshot showed total crypto market capitalization near $2.30T, BTC dominance around 56.55%, and ETH dominance around 9.90%. These publication-time data should not be mixed with TradingView’s weekly hover values, but they support the same message: the crypto market has repaired, but leadership remains concentrated.
Therefore, as the market enters Week 30, the price evidence is better, but the confirmation question is not complete. The strongest bullish case needs the same improvement to appear across several areas at once: higher total market capitalization, improving ETH/BTC, weakening Bitcoin dominance, more stable stablecoin supply, and ETF inflows that do not depend on one or two strong trading sessions. Week 29 delivered part of that checklist, but not all of it.
ETH Leads, but Bitcoin Still Holds Its Role as the Market Anchor
BTC had a constructive week. It opened around $63,780, traded as high as $65,600, fell as low as $61,825, and closed around $64,723. The 1.48% weekly gain was useful because it helped BTC repair its short-term market structure, but it was not the strongest part of the crypto move.
ETH performed better. It opened around $1,807, rose to $1,947, held its weekly low around $1,750, and closed around $1,872. The 3.62% weekly gain pushed ETH/BTC from 0.028329 to 0.028927, a relative improvement of about 2.11%.
ETH Strength Improved the Risk Tone
ETH outperformance matters because it is often the first place traders look to see whether crypto risk appetite is spreading beyond Bitcoin. ETH’s daily RSI closed the week at 59.55, above BTC’s 54.62, which aligns with the same relative strength message. Compared with Week 28, ETH had better momentum, stronger ETF support, and a clearer leadership claim.
But this was not a textbook altcoin season signal. Bitcoin dominance rose from 58.70% to 59.16%, an increase of 0.46 percentage points. That means ETH outperformed BTC in price, while enough capital in the broader market remained anchored in Bitcoin for BTC’s share of total market capitalization to rise. Strong ETH plus rising BTC dominance is not bearish, but it is selective.
| Market Metric | Week 29 Value | Interpretation |
|---|---|---|
| Total crypto market capitalization | $2.13T to $2.19T | Rebound stronger than Week 28 |
| BTC return | 1.48% | Short-term repair |
| ETH return | 3.62% | Led major assets |
| ETH/BTC | 0.028329 to 0.028927 | ETH outperformed BTC |
| BTC dominance | 58.70% to 59.16% | BTC still held the market anchor |
| Fear & Greed | 28 to 28 | Fear persisted despite higher prices |
ETF Flows Brought Real Buying to ETH and BTC
ETF flows were one of the clearest sources of support in Week 29. Spot Bitcoin ETFs started weakly, with CoinGlass showing outflows of about -6.66K BTC on July 13. The rest of the week improved: +2.91K BTC on July 14, +1.66K BTC on July 15, +1.22K BTC on July 16, and +2.07K BTC on July 17. The five-day U.S. ETF window ultimately produced net inflows of about +1.20K BTC.
On a relative basis, Ethereum ETFs were stronger. CoinGlass showed -8.53K ETH on July 13, followed by +32.83K ETH on July 14, +28.50K ETH on July 15, -14.61K ETH on July 16, and +19.69K ETH on July 17. The net result over the same trading window was about +57.88K ETH.
ETF Demand Helped, but Did Not Solve the Breadth Problem
Positive ETF flows help explain why BTC held its range and why ETH outperformed. They show visible institutional demand during a week when market sentiment was still fearful. They also gave the market a more solid demand source than a rebound driven purely by derivatives.
The limitation is breadth. ETF demand is concentrated by design in BTC and ETH. It can stabilize the two largest assets, but it does not necessarily lift the entire altcoin sector automatically. That made the Week 29 move look better, but still selective. The market did have real buyers, but the strongest evidence was concentrated in the two assets with the clearest ETF channels.
Liquidity Still Has Not Fully Confirmed the Rally
The main caution signal came from stablecoin liquidity. DefiLlama data showed total stablecoin supply falling from about $307.8B on July 13 to about $306.6B on July 19, a weekly decline of -0.38%. As of the July 20 publication-time snapshot, USDT was near $184.2B and USDC was near $73.3B.
That does not cancel out the price repair. Markets can rise even when stablecoin supply contracts, especially when ETF demand and positioning are strong enough. But it does make the recovery less clean. A stronger broad risk signal would be rising total market capitalization while stablecoin supply expands or at least stabilizes. Instead, Week 29 showed market value rising while crypto-native dollar-like liquidity weakened slightly.
This was the core contradiction of the week. Price action improved. ETF flows improved. ETH leadership improved. But the liquidity base did not show a matching expansion. For traders, that means this rally deserves respect, but not automatic trust.
It also changes how investors should read altcoin strength. When stablecoin supply is not expanding, individual rallies can still work, but they are more likely to depend on asset-specific catalysts, short squeezes, or relative rotation rather than a rising liquidity tide. That tends to reward selectivity. Compared with assuming every high-beta token will follow ETH higher, this is an environment better suited to ranking assets by actual demand.
Beyond BTC and ETH: Altcoin Breadth Was Mixed
The broader move was more complicated than the ETH leadership headline suggested. CoinMarketCap’s publication-time snapshot showed total crypto market capitalization near $2.21T, CMC20 up 0.4%, the CMC Fear & Greed reading at 35, the Altcoin Season score at 50/100, and average crypto RSI at 47.8. This is a useful breadth snapshot because it looks beyond the two largest assets and asks whether the rest of the market is participating.
The answer was mixed. In the visible CMC 7-day window, ETH led major assets with a 5.76% gain, while BTC rose 3.31%. XRP gained 2.53% and SOL rose 1.26%, showing that some large-cap risk appetite had extended beyond BTC and ETH. But BNB rose only 0.25%, DOGE gained 0.69%, TRX slipped 0.32%, and HYPE fell 4.77%. Stablecoins were flat by design, with USDT down 0.01% over seven days and USDC up 0.01%.
| CoinMarketCap Snapshot Item | 7D / Snapshot Reading | Market Interpretation |
|---|---|---|
| Market cap | $2.21T, +0.29% | Market was positive at publication |
| CMC20 | $131.87, +0.4% | Broad large-cap index improved slightly |
| Fear & Greed | 35, fear | Sentiment remained cautious |
| Altcoin Season | 50/100 | Neutral, not a clear altcoin season |
| Average crypto RSI | 47.8 | Momentum near neutral |
| BTC | +3.31% | Strong anchor |
| ETH | +5.76% | Led major assets |
| XRP | +2.53% | Positive large-cap participation |
| SOL | +1.26% | Participated in the rally, but with weaker strength |
| BNB | +0.25% | Barely positive |
| DOGE | +0.69% | Modest rebound |
| TRX | -0.32% | Slightly negative |
| HYPE | -4.77% | Not all high-beta names participated |
This was not a broad altcoin season signal. The CMC snapshot was close enough to the Week 29 window to be useful, and it showed breadth improving, but not indiscriminate risk appetite. A better description is selective rotation in a recovering market: ETH led, some large-cap assets followed, stablecoins remained the core of liquidity, and several non-BTC/ETH names still lagged.
Liquidation Maps Kept the Setup Two-Sided
CoinGlass liquidation heatmaps added a practical trading layer to the Week 29 setup. The BTC screenshot showed that, in the one-week view for Binance BTC/USDT perpetual contracts, the liquidity threshold was set at 0.85. Visible upside liquidity sat around $65,000-$66,000, with a higher upside zone near $67,000-$68,000. Downside pressure was visible near $63,000-$64,000, around $62,000, and across the broader $60,000-$61,500 area.
For ETH, the Binance ETH/USDT perpetual one-week heatmap showed upside liquidity near $1,900, around $1,950, and toward $2,000-$2,020. Downside pressure was visible at $1,830-$1,850, $1,780-$1,800, and the broader $1,700-$1,750 area.
Funding rates did not look euphoric. In the July 20 snapshot, the Binance BTCUSDT funding rate was about 0.0086%, while the ETHUSDT funding rate was about 0.0043%. For Binance-only open interest, BTCUSDT was near 102,347 BTC contracts and ETHUSDT near 2,312,844 ETH contracts. These are not market-wide aggregate open interest figures, but they show leverage was present while not making the entire setup look extremely overheated.
Liquidation maps should be used as pressure maps, not forecasts. In Week 29, they were a reminder to stay humble. If follow-through appears, both BTC and ETH have upside areas that could matter, but if the market loses momentum, both also have nearby downside zones.
What to Watch Next Week
The first checkpoint is whether total crypto market capitalization can hold above $2.19T and move toward the level near $2.30T in CoinGecko’s July 20 snapshot. If market capitalization keeps rising while stablecoin supply stabilizes, the recovery will be easier to trust.
The second checkpoint is ETH/BTC. ETH led in Week 29, and that matters. If ETH/BTC continues to rise while BTC dominance eventually turns lower, the market will have a better rotation signal. If ETH/BTC stalls while dominance continues to climb, the Week 29 move will look more like selective ETH strength than broad altcoin risk appetite.
The third checkpoint is ETF consistency. Both BTC and ETH ETFs ultimately closed with positive inflows, but both also had outflow days. Cleaner consecutive inflows would strengthen the institutional demand argument.
Finally, watch the liquidation zones. BTC reclaiming the mid-$65,000s and ETH reclaiming $1,900 could allow upside pressure to take effect. BTC falling below the low-$63,000s or ETH falling below $1,830 would bring downside leverage zones back into focus.
Trade Crypto With Leverage — Without Giving Up Custody
Decentralized perpetual exchanges have moved far beyond niche status. According to CoinGecko's 2025 Annual Crypto Report, DEX perpetual trading volume surged 346% last year — reaching $6.7 trillion — while centralized exchange open interest fell 20.8% over the same period. Traders are committing significant capital to on-chain derivatives for straightforward reasons: counterparty risk is real, custody failures happen, and censorship resistance matters.
edgeX is a decentralized perpetual futures exchange built for traders who want market access without sacrificing control. Here is where it differs:
- No KYC, no barriers. Connect your wallet and start trading. No identity verification, no account approval — wherever you are, onboarding is fast.
- True self-custody. edgeX combines off-chain order matching with verifiable on-chain settlement secured by Ethereum. A forced withdrawal mechanism lets your funds be recovered directly from the blockchain even if the operator stops service.
- Deep liquidity, tight spreads. edgeX maintains $10 million of market depth within a one-basis-point spread, with slippage below 0.1 basis points for trades over $100,000. When crypto markets move quickly, that precision matters.
- Up to 100x leverage. Size positions according to your conviction — whether you are hedging exposure or trading momentum.
- 140% trading fee rewards. Active traders can earn back more in rewards than the fees they pay, reducing the net cost of high-frequency strategies over time.
- Institutional-grade infrastructure. edgeX can process up to 200,000 orders per second, with matching latency below 10 milliseconds — performance comparable to major centralized exchanges, without taking on custody trade-offs.
Start trading crypto perpetual futures on edgeX and put your market view to work.
FAQ
Which week does this Crypto Market Watch cover?
This Crypto Market Watch covers Week 29 of 2026, from July 13 to July 19, 2026. July 20 data is used only for publication-time context, such as CoinGecko global market capitalization, stablecoin snapshots, funding rates, open interest, and liquidation maps.
Was Week 29 bullish for the crypto market?
It was constructively bullish, but not fully broad. Total crypto market capitalization rose about 2.82%, ETH gained 3.62%, BTC rose 1.48%, and ETF flows were positive. The caution is that BTC dominance increased and stablecoin supply fell.
Did ETH outperform Bitcoin?
Yes. ETH rose 3.62%, compared with BTC's 1.48% gain, and ETH/BTC improved by about 2.11%. The complication is that Bitcoin dominance still rose, so ETH leadership did not translate into clean market-wide rotation.
What was the most important risk signal?
The most important risk signal was liquidity. Total stablecoin supply declined -0.38% in Week 29, which made the rally look more like a selective rebound than a fully liquidity-driven expansion.
Why do liquidation maps matter?
Liquidation maps show where leverage may accelerate price movement. The Week 29 review used BTC and ETH heatmaps qualitatively, focusing on visible pressure zones rather than precise liquidation-size claims.

