USDCHF Tests 200-Hour Moving Average Near 0.8050 as Buyers Try to Break Higher
Key Takeaways
- •USDCHF found support at 0.8007, just above the rising 100-hour moving average and nearby retracement levels.
- •Buyers have pushed the pair higher after it tested the lower end of the recent support area.
- •The next major resistance is near 0.8050, where the falling 200-hour moving average and broken 38.2% retracement converge.
- •A sustained break above 0.8050 would improve the short-term bullish outlook and give buyers more control.
- •If sellers hold the 0.8050 area, the pair could move back toward the 100-hour moving average.
USDCHF Tests 200-Hour Moving Average Near 0.8050 as Buyers Try to Break Higher
USD
CHF
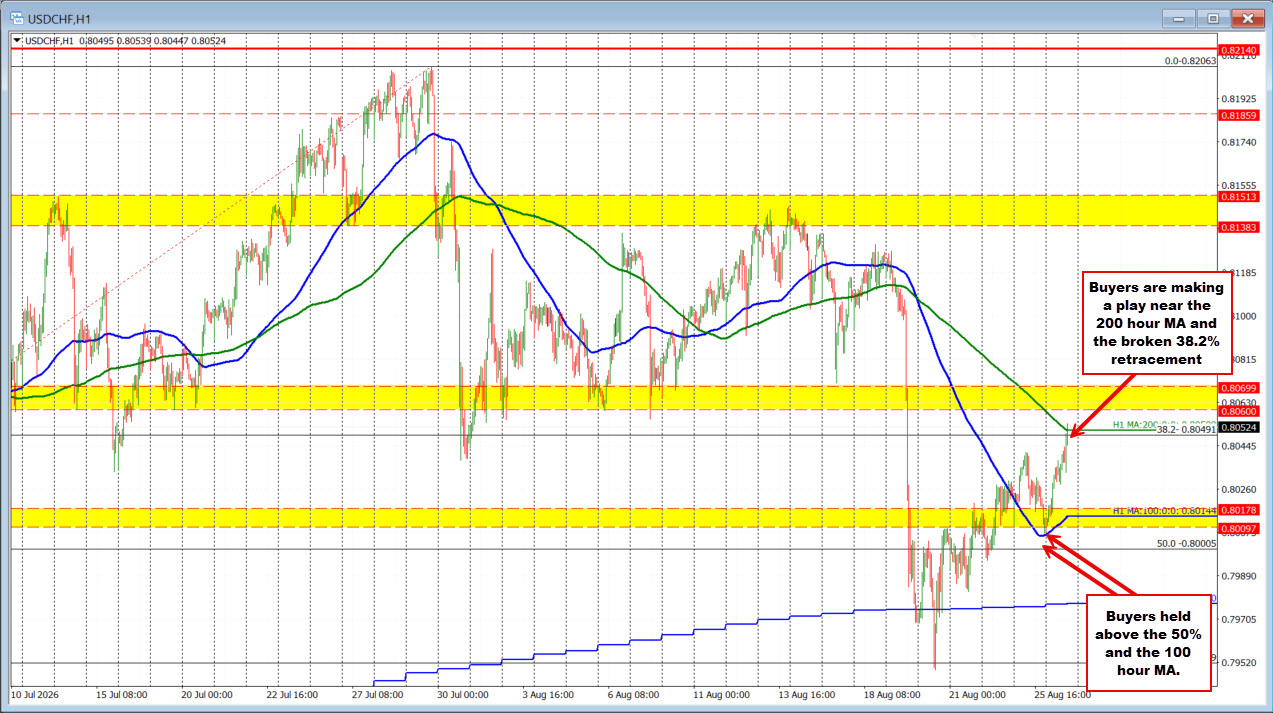
USDCHF traders are testing the 200-hour moving average and the broken 38.2% retracement near 0.8050. A move above and sustained trade above that level would open the door to further upside momentum.
In a post yesterday, I highlighted the importance of the USDCHF swing area extending down to 0.8009, along with the rising 100-hour moving average, shown as the blue line on the chart below, and the 50% retracement near 0.8000.
Today’s low reached 0.8007, which fell between those key levels and just above the 100-hour moving average. Buyers leaned against that support cluster and have since pushed the price steadily higher.
That reaction matters because it shows the market is still responding to nearby technical levels rather than drifting lower through support. For short-term traders, the 100-hour moving average remains the key support and risk-defining level, while the 0.8050 zone is the next hurdle that needs to give way for buyers to gain more control.
The rebound has now carried USDCHF toward the next key resistance cluster near 0.8050. That area is defined by the falling 200-hour moving average and the broken 38.2% retracement.
Getting above 0.8050 and staying above it would strengthen the short-term bullish bias and give buyers more control. If sellers defend the resistance cluster, however, price could rotate back toward the 100-hour moving average. The setup keeps the pair pinned between nearby support and resistance, with the current battle centered on whether buyers can convert the recovery into a more durable move.
For now, buyers have stepped in at support and pushed the price higher. Even so, they still need to clear the 0.8050 resistance cluster to open the door to additional upside momentum.
Must Read
What is tradeCompass at investingLive.com: Trading methodolgy explained and how traders can utilize it
Zoom Stock Faces a Two-Part Earnings Test: Core Growth and Anthropic
Nvidia Earnings Tonight: NVDA Levels and Trade Plan
Gold holds near three month high as markets await US inflation data
AUD higher, Australian CPI beats forecasts as core inflation surprises to the upside
Oil slides $2 on unconfirmed report of US Iran ceasefire, Hormuz reopening
The AI leaders can't be trusted for AI predictions
Fed's Collins: Inflation is still too high
What are the main events for today?
Nasdaq Analysis: Two Critical Levels to Watch Around Nvidia Earnings
Oil prices sink as expectations for an imminent US-Iran deal increase. What's next?
Stablecoins is a big thing and as an investor, here's what you need to know about it
Best in 2026
Sponsored

