USD/JPY Rebound Stalls at 158.55 Inflexion Level Ahead of US Non-Farm Payrolls
Key Takeaways
- •A historic coordinated US-Japan foreign exchange intervention on 30 and 31 July 2026 strengthened the yen from a 40-year low of 163.99 per dollar to 155.23 by 3 August.
- •USD/JPY subsequently rebounded 2.08% over three days to close at 158.46 on 6 August, erasing nearly half of the yen's post-intervention gains.
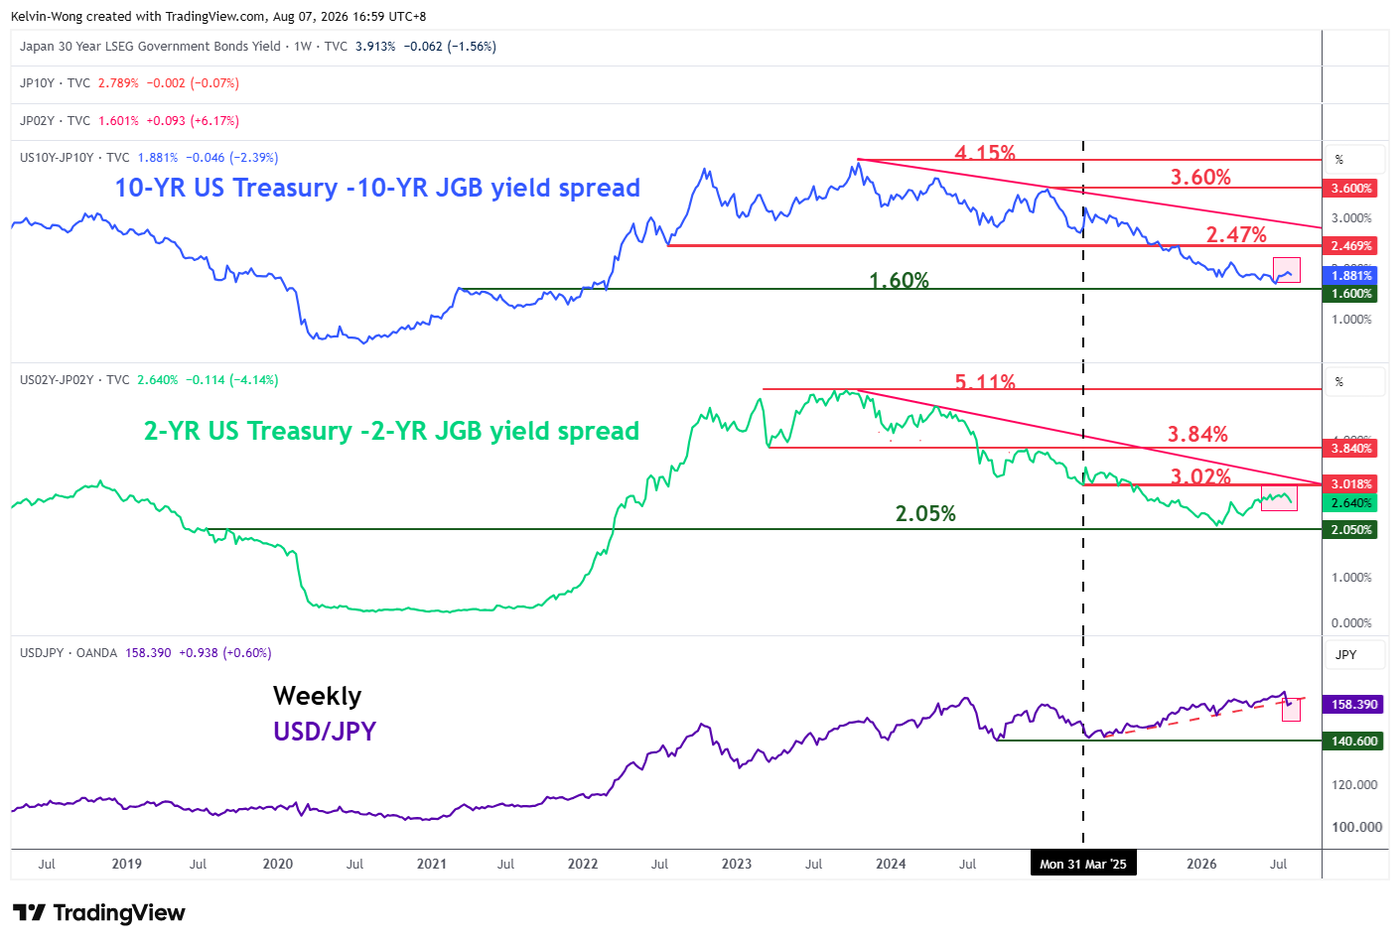
- •The 2-year UST-JGB yield spread has narrowed from 2.82% to 2.64%, reinforcing a bearish technical breakdown in USD/JPY from its former ascending trendline support.
- •Technical indicators including a bearish flag pattern and hourly RSI divergence suggest an imminent minor bearish reversal at the 158.55 inflexion level, with a break below 157.95 potentially exposing support at 157.30 and 156.32.
- •Geopolitical uncertainty surrounding the US-Iran situation may delay the Bank of Japan's gradual interest rate normalisation, which remains a key longer-term driver of yen weakness.
The USD/JPY rebound is losing momentum at the key 158.55 inflexion level, with technical signals indicating bearish reversal risk as traders turn their attention to the upcoming US non-farm payrolls report.
The Japanese yen experienced a three-month decline from May 2026, plunging to a 40-year low of 163.99 per US dollar on 23 July 2026. This weakness was reversed by a two-day foreign exchange intervention that included a historic US-Japan joint effort on 30 and 31 July 2026—the first confirmed coordinated intervention by the two nations in years—which strengthened the yen to 155.23 by Monday, 3 August 2026.
However, the yen's rally stalled thereafter. USD/JPY staged a three-day rebound of 2.08% (low to close), finishing at 158.46 on Thursday, 6 August 2026—nearly erasing half of the gains the yen had posted following the intervention.
Speculators remain focused on longer-term dynamics, including geopolitical uncertainty stemming from the US-Iran situation, which could weigh on Japan's growth prospects. This, in turn, may delay the Bank of Japan's (BoJ) normalization of its monetary policy stance of gradual interest rate hikes. Japan has maintained ultra-low interest rates for years, and the BoJ's slow path toward normalization stands in sharp contrast to other major central banks, making any delay in rate hikes a key driver of yen weakness.
UST-JGB Yield Spread Narrows
The rise in USD/JPY (yen weakness) from 152.71 to July's 40-year high of 163.99 was accompanied by a widening of the policy-sensitive 2-year yield spread between US Treasury Notes (UST) and Japanese Government Bonds (JGB), which moved from 2.12% to 2.82% over the same period. This spread is closely watched by FX traders because it reflects the short-term interest rate divergence between the two economies, which directly influences capital flows into and out of yen-denominated assets.
The 2-year UST-JGB yield spread has since reversed downward, narrowing from below a key medium-term resistance of 3.02% to trade at 2.64% at the time of writing. This development reinforces a major bearish breakdown of USD/JPY from its former ascending trendline support dating to April–May 2026.
A continued narrowing of the spread toward 2.05% could revive USD/JPY weakness, particularly given the upcoming US non-farm payrolls release for July, scheduled for 8:30 pm SGT (June figure: 57K; consensus: 80K). Weaker-than-expected US labor data would reinforce expectations of Federal Reserve rate cuts, further compressing the yield advantage that has supported the dollar against the yen.
Technical Outlook: Inflexion Point at 158.55
The three-day USD/JPY rally from Monday, 3 August 2026, when it hit a low of 155.23, has reached an inflexion level at 158.55. This level is defined by a confluence of technical factors: the former major ascending trendline from the 22 April 2025 low, the former minor swing low of 31 July 2026, and the 38.2% Fibonacci retracement of the prior down move from the 30 July 2026 high to the 3 August 2026 low.
The recent price action in USD/JPY is likely to have formed a minor bearish flag pattern, suggesting a pause within an ongoing short-term downtrend. This is coupled with a bearish divergence in the hourly RSI momentum indicator at its overbought region.
With USD/JPY pushing up to the 158.55 inflexion level (intraday high of 158.57 at the time of writing) amid these bearish elements, the pair may be due for an imminent minor bearish reversal.
A break below the downside trigger level of 157.95 (the 200-day moving average) could reinforce the bearish reversal scenario, exposing intermediate support levels at 157.30 and 156.32.
Conversely, an hourly close above the key short-term pivotal resistance at 158.55 would invalidate the bearish scenario, potentially opening the door to a further move toward the medium-term resistance at 159.45.
Source: OANDA MarketPulse

