Retail Sales Miss: 0.6% Drop Versus Expected 0.1% Rise
Key Takeaways
- •U.S. retail sales declined 0.6% in the latest monthly report, well below the expected 0.1% increase.
- •The Census Bureau's advance retail sales figure is based on a preliminary subsample of firms and is routinely revised in subsequent monthly releases.
- •Retail sales primarily track goods-focused consumer purchases and offer one of the earliest monthly reads on household spending, the largest component of U.S. economic output.
- •The weak reading is being assessed alongside indicators including the Philadelphia Fed's early benchmark payroll revisions, manufacturing production, real retail sales, a freight services index, state coincident indexes, and GDO, the average of GDP and GDI.
- •Scheduled updates from the Census Bureau's retail sales revisions, the Philadelphia Fed's next quarterly early benchmark release, and BEA's follow-on estimates of 2026Q2 output will refresh the economic picture.
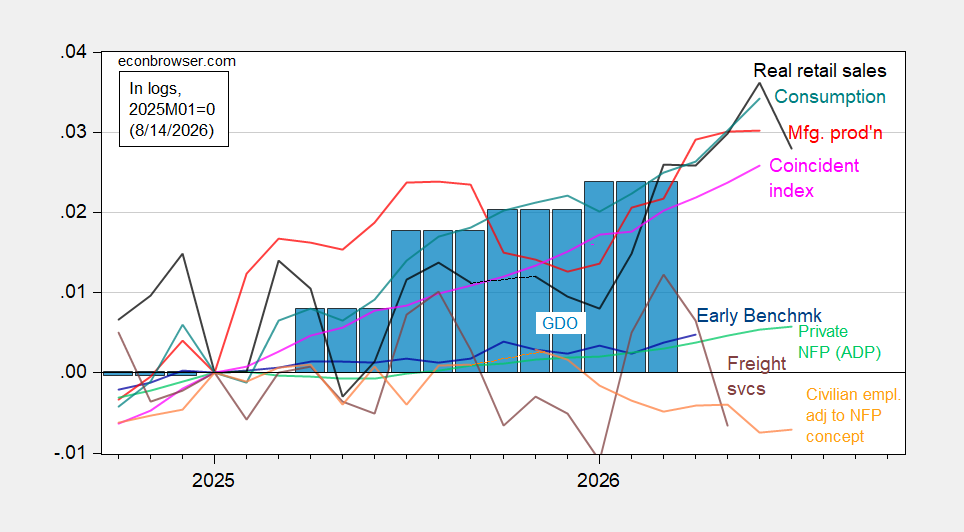
Retail sales fell 0.6% in the latest monthly report, rather than posting the +0.1% increase that had been expected.
Household spending is the largest component of U.S. economic output, and retail sales — which track primarily goods-focused consumer purchases — offer one of the earliest monthly reads on that demand. The Census Bureau's advance figure is based on a preliminary subsample of firms and is routinely revised in subsequent monthly releases, one reason analysts cross-check it against a wider set of indicators rather than reading any single month in isolation.
The reading sits alongside a broader set of cyclical indicators used to track the current state of the U.S. economy. As laid out in the source analysis (Figure 1), the series monitored — all log-normalized to 2021M11 = 0, so that each line shows cumulative change since November 2021 — are:
- Implied nonfarm payroll (NFP) early benchmark (bold blue)
- Civilian employment adjusted to the NFP concept, smoothed population controls (bold orange)
- Manufacturing production (red)
- Personal income excluding current transfers in Ch.2017$ (bold green)
- Real retail sales (black)
- Freight services index (brown)
- Coincident index in Ch.2017$ (pink)
- GDO (blue bars)
The underlying data are drawn from the Philadelphia Fed's early benchmark revisions and state coincident indexes, the Federal Reserve, the Bureau of Transportation Statistics via FRED, the BEA 2026Q2 advance release, and the author's calculations. The scheduled updates that will refresh this picture are the Census Bureau's revisions to the retail sales figures in coming monthly reports, the Philadelphia Fed's next quarterly early benchmark release, and BEA's follow-on estimates of 2026Q2 output, which are published after the advance release cited here.
Background: U.S. retail sales are compiled and released monthly by the Census Bureau; "real" retail sales adjust those nominal figures for inflation. The Philadelphia Fed's early benchmark revisions provide quarterly updates to state-level payroll employment ahead of the annual benchmark process and have in the past signaled the direction of subsequent national payroll revisions. The Philadelphia Fed's state coincident indexes combine four state-level indicators — nonfarm payroll employment, the unemployment rate, average hours worked in manufacturing, and real wage and salary disbursements — into a single measure of economic activity for each state. GDO, or gross domestic output, is the average of gross domestic product (GDP) and gross domestic income (GDI) and serves as a summary gauge when the two output estimates diverge.
This article was first published August 14, 2026, on Econbrowser.

