US Housing Stock Grew by 1.507 Million Units in 12 Months as Vacancies Continued to Rise
Key Takeaways
- •The US housing stock increased by 1.507 million units over the 12 months through Q2, bringing the total to 149.45 million units.
- •US population growth through July 2026 is estimated at 757,000, far below the pace of housing additions.
- •Year-round vacant housing units reached 12.22 million in Q2, equal to 8.2% of total housing stock.
- •Vacant homes on the market for rent or sale rose 5.5% year over year to 4.75 million, the highest level since Q3 2017.
- •The article says inventory for new single-family homes remains elevated in the South and West while sales have fallen from 2019 levels.
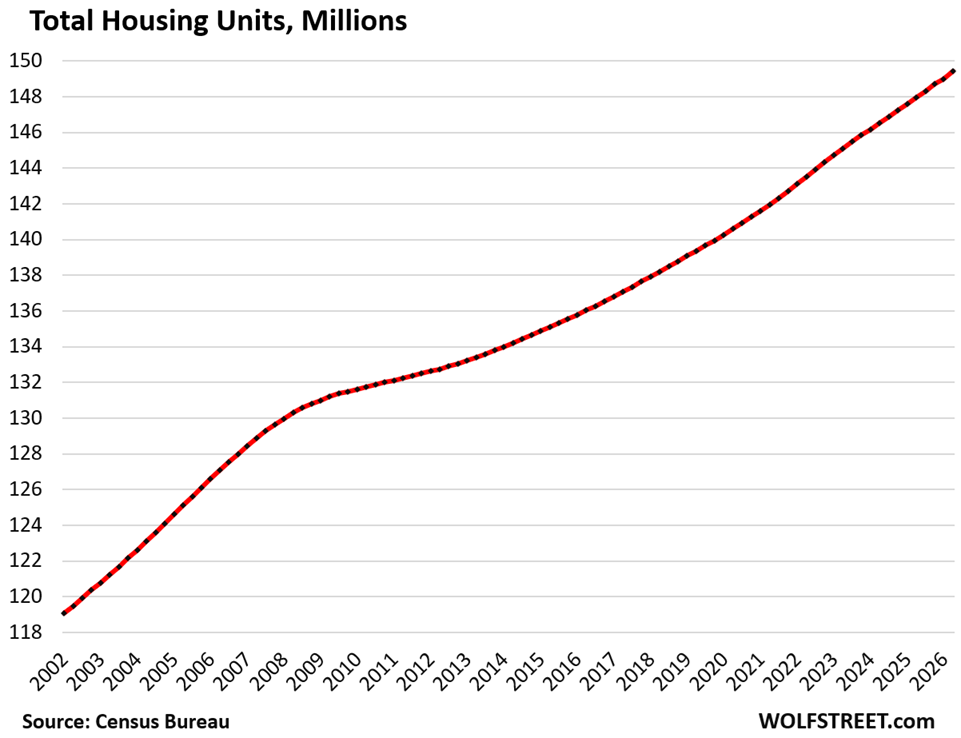
The US added 1.507 million housing units, after new construction minus demolitions, over the 12 months through Q2, bringing total housing stock to 149.45 million units, according to Census Bureau data released Tuesday.
Those units include single-family homes, townhomes, duplexes, accessory dwelling units, condominiums, and apartments. Using the US average household size of 2.3 people per housing unit, the increase amounts to housing for an additional 3.47 million people.
Population growth, however, has slowed. For the 12-month period through July 2026, the US population is estimated to have increased by only 757,000 people, according to separate Census Bureau data released earlier this year.
Over the past five years, the total US housing stock increased by 7.51 million housing units, which at the average household size would provide housing for 17.3 million additional people. Over the same period through July 2026, the US population is estimated to have grown by 10.4 million people, including the two-decade-record surge in 2023 and 2024, according to the article’s analysis.
The result is that housing stock has grown faster than the population over the five-year period, and that imbalance is showing up in vacancy data.
Vacant housing stock rises
There were 15.64 million vacant housing units in Q2. Of those, 12.22 million were classified as “year-round vacant,” equal to 8.2% of the total housing stock, and 3.44 million were classified as “seasonal vacant.”
“Year-round vacant” does not mean vacant for an entire year. Rather, it refers to units intended for occupancy at any time of year, as opposed to units intended for seasonal occupancy.
Year-round vacant units are grouped into several categories:
- vacant for rent
- vacant for sale
- rented or sold but new tenants or owners have not yet moved in
- held off the market, including for occasional use, temporarily occupied by people whose usual residence is elsewhere, or vacant for other reasons
Vacant units on the market for sale or for rent increased 5.5% year over year, or by 249,000 units, to 4.75 million, the highest level since Q3 2017. That matters because these are the units most directly exposed to current market conditions and pricing.
Over the past five years, vacant year-round units for rent and for sale increased by 1.10 million.
The article notes that some homes originally listed for sale but not sold are later moved to the rental market, reducing vacant for-sale inventory and increasing vacant for-rent inventory. If owners succeed in renting them out, they become what the industry calls “accidental landlords,” and the units move from the vacant list to the occupied list.
Year-round vacant units can also be pulled off the market and placed into the “held off the market” category.
Vacant units on the market for rent, including homes shifted by “accidental landlords,” rose 5.1% year over year, or by 181,000, to 3.73 million, the highest since 2013. Over the past five years, year-round vacant units for rent increased by 807,000.
Vacant units on the market for sale rose 7.2% year over year, or by 68,000, to 1.02 million. These figures exclude homes that are for sale but still occupied, which are counted among occupied housing units. Because the data are not seasonally adjusted, some seasonality appears in for-sale inventory.
Over the five-year period, vacant for-sale units rose 41%, or by 297,000.
Some of the units that were once vacant for sale have shifted into the vacant for-rent category as owners moved properties into the rental market.
Vacant units that were rented or sold but not yet occupied rose 5.8% year over year to 1.00 million. Over the past five years, that number fell 10%.
Held-off-the-market inventory shrinks
Of the 12.22 million year-round vacant units, 6.55 million were held off the market for various reasons. This category includes units held for occasional use, temporarily occupied units where the usual resident lives elsewhere, and units vacant for other reasons, such as settlement of an estate or personal reasons of the owner.
The article says that as vacant for-sale and vacant for-rent units have increased over the past five years, the number of year-round vacant units held off the market has declined. In other words, part of the shadow inventory has already moved into actual for-sale or for-rent listings.
Related market data
Using separate data, the article points to continued inventory pressure in new single-family homes:
- In the South, inventory for sale of new single-family homes was up 71% from 2019, while sales were down 8%.
- In the West, inventory for sale of new single-family homes was up 22% from 2019, while sales were down 50%.
The article also says the gap between single-family rents and multifamily rents has widened sharply, based on a look at 14 large markets.
Relevant linked articles cited in the source include:
- Population Growth Slows to a Crawl, Net Migration May Turn Negative, Census Bureau’s New Population Estimates
- New Single-Family Home Prices Drop Further amid Declining Sales and Once Again Growing Inventory Glut
- Single-Family \u0026 Multifamily Rents in Face of an Onslaught of New Supply \u0026 Fading Population Growth
The source also includes links to Wolf Street, the author page for Wolf Richter, and a donation page at how to donate to WOLF STREET.

