US Household Debt Dips to $18.77 Trillion in Q2 2026 as Debt-to-Income Ratio Hits Lowest Level in Two Decades
Key Takeaways
- •Total US household debt declined by $23 billion to $18.77 trillion in Q2 2026, with the decrease driven primarily by a $74 billion mortgage balance reduction linked to temporary technical reporting issues.
- •Annual household debt growth of 2.1% marked the smallest yearly percentage increase since 2015.
- •The household debt-to-disposable-income ratio fell to 79.4%, reaching its lowest level outside of the pandemic stimulus period in data going back to 2003.
- •The New York Fed clarified that the rising overall stock of delinquent debt reflects stale charged-off debts remaining on credit reports rather than a fundamental worsening in new delinquency incidence.
- •Foreclosures, third-party collections, and new bankruptcies all remained near historically low levels during the quarter.
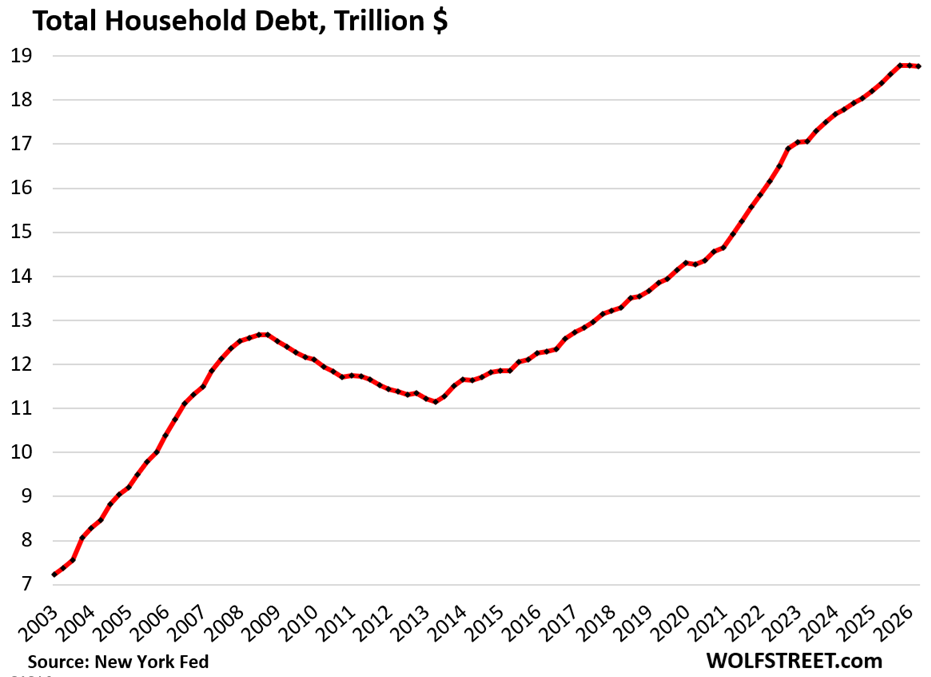
Total Household Debt Declines Slightly in Q2
Total outstanding household debt in the United States — encompassing mortgages, HELOCs, student loans, auto loans, credit card balances, and other consumer loans such as personal loans and BNPL loans — declined by $23 billion, or 0.1%, from the first quarter to $18.77 trillion in Q2 2026, according to the Household Debt and Credit Report released by the New York Fed. The report draws on data obtained through the New York Fed's partnership with Equifax. The decline follows a first quarter in which total household debt was essentially flat. The quarterly Household Debt and Credit Report is widely tracked by economists and policymakers as a key barometer of consumer financial health, given that household spending accounts for roughly 70% of US gross domestic product.
The Q2 decrease was driven primarily by mortgage balances, which fell by $74 billion due to what the New York Fed described as temporary technical reporting issues. Because mortgages represent the largest single component of household debt — approximately 70% of the total — a reporting adjustment of this magnitude can materially shift the headline figure, and subsequent quarterly releases may reconcile the discrepancy. However, several other debt categories moved in the opposite direction: HELOC balances increased from the prior quarter, auto loan balances rose, credit card balances edged slightly higher, and student loan balances declined.
On a year-over-year basis, household debt grew by $383 billion, or 2.1% — the smallest annual percentage increase since 2015.
Debt Burden Relative to Income Reaches Near-Record Low
The debt-to-disposable-income ratio, a standard metric for evaluating household debt burden, declined to 79.4% in Q2 2026 as disposable income reached a record level while debt balances dipped. Disposable income, as defined by the Bureau of Economic Analysis, comprises after-tax wages along with income from interest, dividends, rentals, farm income, small business income, and government transfer payments. It excludes capital gains — the primary income source for wealthy households — including stock-based compensation and capital appreciation.
The 79.4% ratio represents the lowest level in data going back to 2003, with the exception of two quarters during the pandemic stimulus era, when disposable income was temporarily inflated by government programs including stimulus checks, PPP loans, and numerous other initiatives.
For context, in the period leading up to the Financial Crisis, household leverage was significantly higher. When the debt-to-disposable-income ratio exceeded 110%, the housing market and broader financial system experienced severe disruption.
Household Balance Sheets Remain Relatively Strong
Household balance sheets are in comparatively strong condition overall, in contrast to some other economic sectors that carry elevated leverage — including the federal government, certain areas of the financial industry, and specific corporate entities. This divergence means that the household sector, which drives the majority of economic activity through consumption, is on more solid footing than several institutional sectors that do not directly fuel consumer spending at the same scale.
Approximately 65% of US households own their homes, with home prices having risen substantially through mid-2022. Roughly 40% of homeowners own their properties free and clear, while many others carry relatively small remaining mortgage balances. Over 60% of households hold at least some equities, the value of which has continued to appreciate. Households also hold precious metals, cryptocurrencies, approximately $5.2 trillion in money market funds, and significant amounts in certificates of deposit.
Delinquency Rates Reflect Stable Consumer Position
The expiration of federal student loan forbearance policies beginning in 2025 had a significant impact on delinquency data. During the forbearance program, which had been in effect since 2020, borrowers were not required to make payments and their loans were not classified as delinquent. When forbearance largely ended in 2025, those federal student loans reappeared on credit reports as delinquent, causing student-loan delinquency rates to surge into double digits. Over the past two quarters, however, fewer student loans have transitioned into delinquency, though the percentage of loans that have remained delinquent since the 2025 policy change remains substantial. How these loans progress through later delinquency stages — and whether borrowers cure them — will be a key metric to monitor in coming quarters. Student loan balances total $1.65 trillion.
Early-Stage Delinquencies (30–59 Days)
The amount of household debt — mortgages, HELOCs, auto loans, credit cards, and student loans — that had turned 30 days delinquent by the end of Q2 but remained under 60 days ticked up to 1.05% of total household debt balances. This level sits within the low range observed before the pandemic. The influx of student loans into this category in 2025 caused a temporary spike, but as fewer student loans became newly delinquent this year and existing delinquent student loans progressed into the 60-day and 90-day categories and beyond, the 30–59-day delinquency rate has settled back down.
Mid-Stage Delinquencies (60–89 Days)
Delinquent balances that were not cured during the prior 30–59-day period and progressed into the 60–89-day category dipped to 0.4% of total debt balances.
Later-Stage Delinquencies (90–119 Days)
Loans that remained uncured through the two prior periods and were still delinquent saw their rate decline to 0.2%.
Combined, these three categories — debt that was between 30 and 119 days delinquent at the end of Q2 — represented 1.7% of total household debt, indicating a consumer base in relatively stable condition.
New York Fed Clarifies Rising Stock Delinquency Rates
The overall stock of delinquent debt on credit reports has continued to rise, drawing considerable attention. However, the New York Fed addressed this issue in a blog post clarifying that these were "stale, charged-off debts" that had not been removed from reporting, whereas in previous years such debts would have been purged. The post summarized: "We find that the stock delinquency rate is rising because of a pool of stale, charged-off debts that lenders have been reporting for longer durations, rather than a fundamental worsening in the incidence of delinquency."
By disaggregating delinquency data and focusing on debts that became delinquent within the prior 120 days, analysts can better assess current consumer health while filtering out the distorting effect of stale, charged-off debts that remain on reports. This approach also reveals the extent and speed with which consumers are curing delinquent obligations.
These near-term delinquency rates are held down by mortgage delinquencies, which remain at healthy levels. Mortgages account for approximately 70% of total household debt. Delinquency rates for other loan types are meaningfully higher.
Foreclosures, Collections, and Bankruptcies Remain Near Historical Lows
New foreclosures in Q2 edged down to 55,160. During the mortgage forbearance era, foreclosures had effectively dropped to near-zero. While foreclosures have risen from those near-zero levels — producing large percentage increases that generated notable headlines — they have consistently remained below the low end of the range seen during the 2018–2019 period and well below historical norms.
Third-party collections continued at rock-bottom levels. The percentage of consumers with third-party collection entries on file within the past 12 months dipped to 4.9%. According to the New York Fed's Data Dictionary, credit accounts such as credit cards make up only a small proportion of collection actions; the majority stem from unpaid medical and utility bills. The data is based on public records and credit reports. For comparison, during the Great Recession and the subsequent unemployment crisis, unpaid bills surged, pushing third-party collection entries to a peak of over 14% in 2013.
New bankruptcies also remained near historic lows. The number of consumers with new bankruptcy filings during the quarter edged up to 136,800 in Q2 — far below the low end of pre-pandemic levels.
