U.S. Real GDP Grows at 1.5% Annual Rate in Q2 2026, Continuing Modest Expansion
Key Takeaways
- •U.S. real GDP grew at a seasonally adjusted annual rate of 1.5% in the second quarter of 2026, approximately half the post-1947 historical average of 3.1%.
- •The Econbrowser recession indicator index remained at 7.0% in Q2 2026, reflecting a backward-looking probability estimate derived solely from GDP growth patterns.
- •Nonresidential fixed investment, including spending on AI infrastructure, contributed to growth, but the net GDP impact was reduced because many components were imported rather than domestically produced.
- •Consumer spending stayed strong in Q2, partly sustained by inventory drawdowns that could constrain future growth if inventories are not replenished.
- •Geopolitical instability in the Strait of Hormuz continues to drive oil price volatility, presenting an ongoing headwind for U.S. economic growth and inflation.
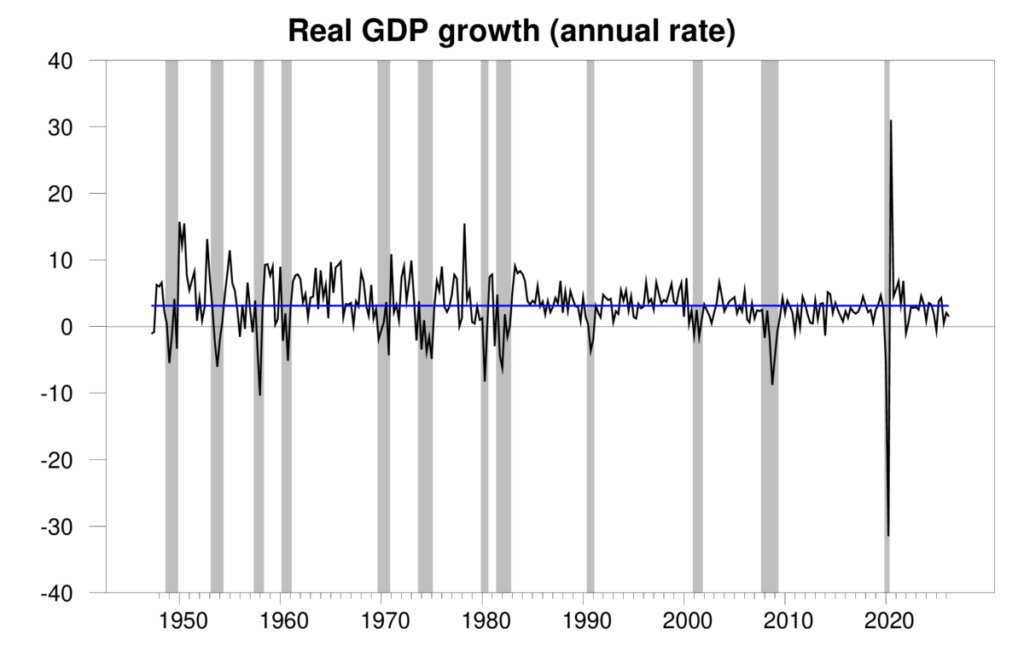
The Bureau of Economic Analysis announced that seasonally adjusted U.S. real GDP grew at a 1.5% annual rate in the second quarter of 2026. This figure represents roughly half of the historical average growth rate of 3.1% recorded since 1947 and extends a trend of sluggish growth seen over the past three quarters. Growth at this pace is generally sufficient to keep the economy expanding and add jobs, but it leaves limited margin to absorb shocks—a dynamic that has kept recession-watch metrics elevated despite the absence of two consecutive quarters of contraction.
Quarterly real GDP growth at an annual rate was calculated from 1947:Q2 through 2026:Q2, with the long-run historical average of 3.1% since 1947. The methodology uses 400 times the difference in the natural log of real GDP from the previous quarter.
The latest figures place the Econbrowser recession indicator index at 7.0%, approximately unchanged from the previous quarter. The index is derived from historical patterns in GDP growth alone, making it a backward-looking probability estimate rather than a forecast of future downturns. The GDP-based recession indicator index is plotted using values derived solely from GDP numbers publicly available one quarter after each indicated date, with 2026:Q1 as the most recent date shown. Shaded regions on the index chart correspond to the National Bureau of Economic Research's (NBER) official recession dates, which were not used in constructing the index.
Several patterns from the prior quarter persisted into Q2. Nonresidential fixed investment, driven in part by spending on AI infrastructure, contributed meaningfully to second-quarter growth. However, because many of the associated components were imported, the net contribution to U.S. GDP—which measures the production of new goods and services within the United States—was more modest. This dynamic highlights a recurring feature in the current cycle: strong domestic capital spending on technology hardware does not automatically translate into measured GDP gains when the production occurs abroad. Consumer spending remained robust, with a portion of sales satisfied through inventory drawdowns rather than new production, a pattern that supports current consumption but can weigh on growth in subsequent quarters if inventories are not replenished.
Geopolitical risks in the Strait of Hormuz remain a source of concern, with oil prices exhibiting significant daily fluctuations in response to reports of potential settlements. The author identifies ongoing conflict in the Middle East as a persistent headwind for U.S. real GDP growth and inflation, as energy-price volatility affects both business costs and consumer purchasing power.
The full BEA release is available at bea.gov, and the Econbrowser recession index methodology can be found at econbrowser.com/recession-index.

