Econbrowser Charts US GDP Nowcasts Against WSJ and IMF October Forecasts
Key Takeaways
- •The chart compares BEA GDP data with projections from the WSJ, Atlanta Fed, New York Fed, and IMF.
- •The BEA’s third estimate for second-quarter 2026 GDP is the chart’s official benchmark.
- •Atlanta Fed GDPNow and the New York Fed nowcast provide model-based, real-time estimates that update as data are released.
- •The WSJ measure represents the monthly average forecast from surveyed professional economists.
- •The IMF’s World Economic Outlook supplies an internationally coordinated US growth projection, typically issued in April and October.
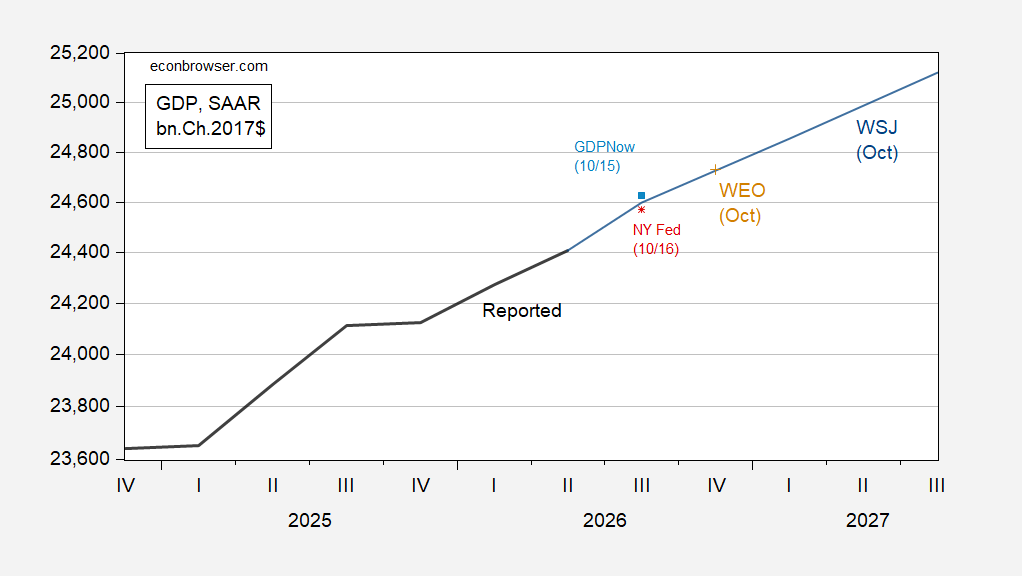
Economics blog Econbrowser has published a new chart comparing the latest estimates of US gross domestic product from several major forecasters, plotting official GDP data alongside projections from The Wall Street Journal, the Federal Reserve Banks of Atlanta and New York, and the International Monetary Fund. Side-by-side comparisons of this kind give readers a way to gauge how real-time model estimates, professional consensus, and internationally coordinated projections stack up against the government's official reading of the economy.
The figure, presented under the heading Nowcasts and WEO, WSJ Forecasts, shows reported GDP as a bold black line, benchmarked to the Bureau of Economic Analysis' third estimate of second-quarter 2026 output. It is set against four other measures: the October mean forecast from The Wall Street Journal's survey of economists, plotted in blue; the Atlanta Fed's GDPNow estimate, marked with light blue squares; the New York Fed's nowcast, marked with red asterisks; and the IMF's October World Economic Outlook projection, marked with tan plus signs.
According to the post, the underlying data are drawn from the BEA's 2026 second-quarter third release, the WSJ survey, the Atlanta Fed, the New York Fed, and the IMF, combined with the author's own calculations.
Nowcasts are real-time estimates of current-quarter growth, compiled as official data arrive with a lag. The Atlanta Fed's GDPNow follows a methodology similar to the BEA's and is updated as high-frequency indicators are released, while the New York Fed's staff nowcast combines a broad set of data sources into a model-based estimate. The WSJ survey aggregates the mean forecasts of professional economists on a monthly basis, and the IMF's World Economic Outlook, typically published in April and October, provides a globally coordinated benchmark that includes US projections.
The BEA publishes quarterly GDP in three stages — advance, second, and third estimates — making the third estimate for the second quarter of 2026 the most recent official benchmark against which the October forecasts and nowcasts are displayed in the chart. With the nowcasts refreshed as new data arrive and the WSJ survey updating monthly, readers can track how each series moves relative to that benchmark while the BEA works toward its next round of quarterly estimates.
The full figure is available at Econbrowser: Nowcasts and WEO, WSJ Forecasts.

