US Existing-Home Sales Fall to 16-Year Low as Mortgage Rates Stay Above 7%
Key Takeaways
- •October existing-home sales dropped 5.5% month over month to a seasonally adjusted annual rate of 3.75 million, the lowest reading since August 2010, and were 8.8% below the level of October 2025.
- •Freddie Mac's average 30-year fixed mortgage rate stood at 7.11% on November 12, down slightly from 7.18% a week earlier but 0.87 percentage points higher than the 6.24% average recorded a year earlier.
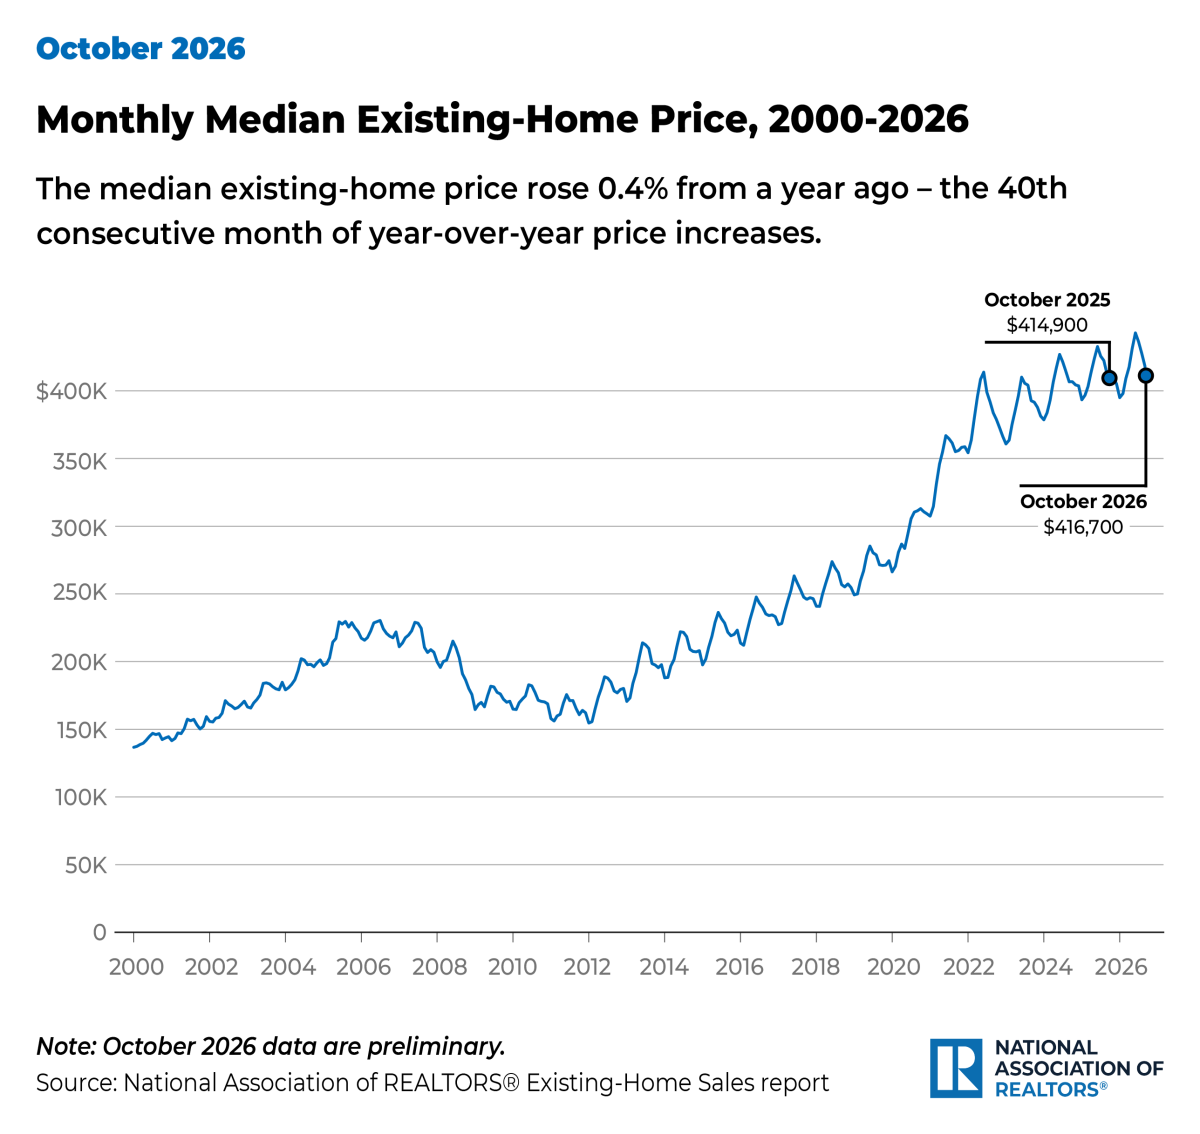
- •Existing-home inventory rose 1.3% from September to 1.59 million units, representing 5.1 months of supply, yet the median price still increased 0.4% year over year to $416,700, marking the 40th consecutive month of annual price gains.
- •First-time buyers accounted for 29% of purchases in October, down from 31% in September and 32% a year earlier, while cash buyers held a 29% share of transactions.
US existing-home sales dropped 5.5% in October to a seasonally adjusted annual rate of 3.75 million, the weakest reading since August 2010, according to the National Association of Realtors. Completed transactions were 8.8% below their level in October 2025.
The downturn comes with borrowing costs still elevated, as the average 30-year fixed mortgage rate has remained above 7%. Freddie Mac put the average at 7.11% on November 12, down slightly from 7.18% a week earlier but well above the 6.24% average recorded a year earlier. Taken together, the figures point to a market in which even a modest improvement in the number of homes for sale has not eased the affordability squeeze.
Prices continued to climb, though only marginally in the latest annual comparison, while first-time buyers made up a smaller share of purchases. Cash buyers, who are less sensitive to mortgage-rate movements, retained a sizeable portion of the market.
Sales fall to the lowest annualized pace in more than 16 years
The 3.75 million annualized rate reflects the pace of sales after seasonal adjustment rather than the literal number of homes sold during October. Even so, the comparison with August 2010 underscores how far activity has retreated: October's result was the lowest in more than 16 years.
The 5.5% month-over-month decline followed a period that was already subdued for resale transactions. The 8.8% year-over-year drop shows that sales were weaker even against October 2025, rather than merely tracking normal seasonal variation.
Existing-home sales are a widely used gauge of the market facing ordinary buyers and sellers because they count completed transactions for previously owned homes. Because purchases of previously owned homes account for the large majority of US home transactions, the series is watched not only as a measure of housing demand but also as a proxy for the moving, renovation and furnishing activity that typically accompanies a change of address. The data do not establish that mortgage rates alone caused October's decline. But the timing matters: financing costs stayed high while prices remained elevated, leaving buyers who need a mortgage facing a markedly different calculation than they did a year earlier.
A 7.11% 30-year rate keeps the affordability hurdle elevated
Freddie Mac reported that its average 30-year fixed mortgage rate stood at 7.11% as of November 12. The 0.07-percentage-point weekly decline offers some relief at the margin, but the rate was 0.87 percentage points higher than the 6.24% average recorded a year earlier.
For a buyer financing a purchase, the mortgage rate shapes the monthly principal-and-interest payment and, by extension, how much home a household can afford within a lender's borrowing limits. The 0.87-percentage-point gap from a year earlier is concrete for household budgets: on a $300,000 loan balance, it translates to roughly $170 more per month in principal and interest, though the exact figure depends on loan size and terms. The rate offered to an individual borrower can differ from the survey average depending on factors including loan terms and borrower qualifications. Taxes, insurance, maintenance and other ownership costs also fall outside the headline rate.
The October sales figures and the November rate reading are not from the same day, and home purchases typically take time to close. Even so, the persistence of rates above 7% provides important context for the exceptionally low sales pace. A small weekly move in rates is not the same as a return to the considerably lower borrowing-cost environment of a year earlier.
More listings have not reversed the rise in prices
Supply did improve in October, but not enough to produce a year-over-year decline in the national median price. Existing-home inventory rose 1.3% from September to 1.59 million units, representing 5.1 months of supply, Reuters reported. Inventory stood 4.6% above its year-earlier level.
A months-of-supply figure estimates how long the available inventory would last at the prevailing sales pace. That measure can increase because more homes come to market, because homes are selling more slowly, or both. In this case, the higher inventory count coincided with a sharp decline in completed sales, so it should not be read simply as a surge in choices for every local buyer.
Rate levels also bear on the supply side. When prevailing mortgage rates sit well above the rates on loans many current owners took out years earlier, homeowners who might otherwise sell face less incentive to list and take on a costlier mortgage — a dynamic commonly described in the industry as the lock-in effect. The NAR data alone cannot isolate how much weight that mechanism carried in any given month, which is one reason inventory figures are read alongside sales and price numbers.
Meanwhile, the median existing-home price rose 0.4% from a year earlier to $416,700 in October, according to the NAR's October report. It was the 40th consecutive month of annual price gains.
The median is the midpoint of transactions, not the price of a typical home in every market, and it can be affected by the mix of homes sold as well as by changes in individual home values. For prospective buyers, however, the combination is straightforward: a larger inventory pool does not automatically translate into lower purchase prices, particularly when the median sale price is still higher than a year earlier.
First-time buyers lose share as cash purchases hold at 29%
First-time buyers represented 29% of existing-home purchases in October, down from 31% in September and 32% a year earlier, NAR said. A one-month change alone does not prove a durable trend, but the annual comparison is consistent with the pressure that high prices and mortgage rates place on buyers entering the market without equity from a prior home sale.
Cash buyers accounted for 29% of October transactions. Their presence does not mean cash purchasers are unaffected by home prices, but they are not exposed to the immediate payment impact of a new mortgage rate in the same way as financed buyers.
Upcoming data will show whether that balance shifts. NAR's next monthly existing-home sales release, its separate pending-home-sales index — which tracks signed contracts ahead of closings — and Freddie Mac's weekly mortgage-rate survey are the measures observers typically follow to see whether supply, prices and borrowing costs move closer to, or further from, their year-earlier levels.
The headline figures therefore show a difficult balance for households considering a purchase: supply was modestly higher and rates eased slightly week to week, yet existing-home sales fell to their lowest annualized pace since 2010, the median price reached $416,700, and the average 30-year fixed rate held at 7.11%.

