Existing U.S. Home Sales Fall for Third Straight Month as Supply Reaches Multiyear Highs
Key Takeaways
- •Existing single-family home sales were 25% below their August 2019 level and 1.1% lower than a year earlier.
- •Sales declined in the South, Midwest, and Northeast, while the West was unchanged from July's downwardly revised level.
- •Single-family inventory rose to 1.42 million homes, and the months of supply increased to 4.7.
- •Condo and co-op sales fell to an annualized 360,000, matching the lowest level in data dating to late 2011.
- •Local housing markets diverged, with single-family prices down as much as 26% in some markets while rising to new highs in others.
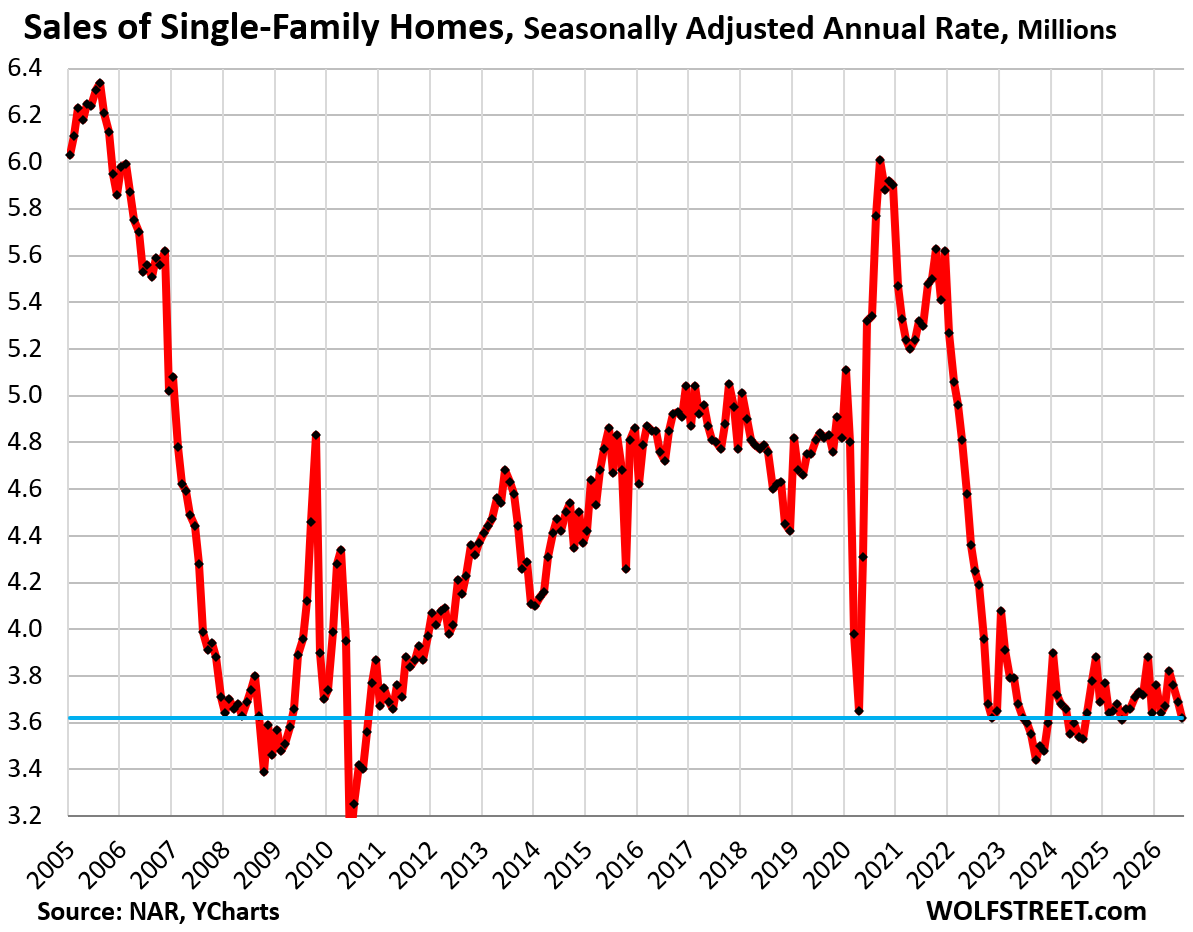
Existing U.S. single-family home sales declined for a third consecutive month in August, while inventories and months of supply rose to their highest levels in years, according to data released by the National Association of Realtors.
Sales of existing single-family homes fell 1.9% in August from July on a seasonally adjusted basis, reaching a seasonally adjusted annual rate of 3.62 million homes. Sales were down 1.1% from the already depressed level a year earlier, 25% from August 2019, 9% from August 2009 during the Housing Bust, and 5% from August 1996.
Single-family inventory increased to 1.42 million homes for sale. Supply rose to 4.7 months, equal to the level recorded in the summer of 2016 and the highest since November 2015. The months-of-supply measure reflects the amount of inventory available at the end of the month relative to the pace of sales during that month. Because inventory rose while sales fell, the increase in months of supply reflected both more homes available and a slower sales pace. Future releases will show whether that higher supply persists and whether the regional sales declines broaden beyond the three regions that fell in August.
Condo and co-op sales also weakened. Sales fell 2.7% from July to a seasonally adjusted annual rate of 360,000, matching the record low in data dating back to late 2011. Sales were down 2.7% from August 2025, 39% from August 2019, and 35% from August 2012, the first August included in the data series.
Condo supply rose to 6.6 months, matching May 2025 and reaching its highest level since 2012.
Sales by region
Sales of existing homes, including single-family homes, condos, and co-ops, declined month over month in three of the four U.S. regions. Sales in the West were unchanged from the downwardly revised July level.
In the South, the seasonally adjusted annual rate of sales fell 1.6% in August from July, marking the third consecutive monthly decline. Sales reached 1.84 million homes. Compared with August in previous years, the changes were:
- 2025: 0% year over year
- 2024: +4.0%
- 2023: 0%
- 2022: -12.4%
- 2019: -20.0%
- 2018: -18.2%
In the West, the seasonally adjusted annual rate remained at 720,000 homes, matching the downwardly revised July figure. Compared with August in previous years:
- 2025: -2.7% year over year
- 2024: -2.7%
- 2023: -2.7%
- 2022: -19.1%
- 2019: -36.8%
- 2018: -35.7%
In the Midwest, the seasonally adjusted annual rate of sales fell 3.1% to 940,000 homes, the fourth consecutive monthly decline. Compared with August in previous years:
- 2025: +2.1% year over year
- 2024: +4.3%
- 2023: 0%
- 2022: -19.2%
- 2019: -23.6%
- 2018: -23.6%
In the Northeast, the seasonally adjusted annual rate fell 4.0% to 480,000 homes. Compared with August in previous years:
- 2025: -2.0% year over year
- 2024: -2.0%
- 2023: 0%
- 2022: -22.6%
- 2019: -31.4%
- 2018: -31.4%
Mortgage rates, inflation, and home prices
The average 30-year fixed mortgage rate rose to 6.76%, according to Freddie Mac’s weekly measure. In the context of the past five decades, that rate is not historically high. It is high relative to the period of Federal Reserve financial repression that began in 2008 and, after a pause, continued into 2022.
During that period, the Federal Reserve purchased trillions of dollars of Treasury securities and mortgage-backed securities, or MBS, in an effort to suppress mortgage rates and other interest rates while supporting higher prices for homes and other assets.
The period ended in 2022 with consumer price inflation at its highest level in 40 years and a historic two-year surge in home prices. That surge subsequently contributed to what has been described as an “affordability crisis” and coincided with depressed home sales. Mortgage rates near 7% are at the lower end of the range seen before the Fed’s financial repression began.
National and local home prices
The national median price of a single-family home declined along seasonal patterns to $434,800 in August on a not-seasonally-adjusted basis. The price was up 1.7% from a year earlier.
The affordability crisis followed a 40% increase in the national median single-family home price during the two years through mid-2022, on top of already elevated prices. Since late 2022, national wages have increased faster than the national median price of single-family homes, gradually easing the affordability pressure over time.
The home-price surge ended in June 2022. Over the four-plus years since then, the source reported the following changes:
- National median single-family home price: +3.3% through the reported period
- Average hourly earnings: +17.3% through August
- Consumer Price Index (CPI): +12.8% through July
National median prices, however, do not directly reflect conditions for individual buyers and sellers because local markets vary significantly. In 15 larger markets, single-family home prices fell between 11% and 26%, including:
- Austin, Texas: -26%
- Oakland, California: -24%
- Cape Coral, Florida: -22%
- New Orleans, Louisiana: -20%
In other large cities, prices continued to rise to new highs. The largest year-over-year increases among the markets listed were:
- Chicago: +4.9%
- Rochester: +4.4%
- New York City: +4.1%
- Milwaukee: +3.5%
The national median price of condos and co-ops also declined along seasonal patterns in August but was up 1.5% year over year. In many local condo markets, prices have fallen substantially from their peaks. The source cited declines of between 15% and 33% from peak levels in 33 larger markets, with several falling below their 2006 highs. Examples included:
- Cape Coral, Florida: -33%
- Oakland, California: -32%
- Petersburg, Florida: -30%
- Austin, Texas: -28%
- Fort Myers, Florida: -27%
- Sarasota County, Florida: -24%
- Garland, Texas: -22%
- Tampa, Florida: -21%
Wolf Street’s related analysis is available in “Oh Dear, Condo Prices Fell by 15% to 33% in 33 Bigger Markets, Some Below 2006 Levels, as Historic Condo Bubbles Deflate”. Its earlier analysis of single-family home prices is available here.

