US Credit Card Delinquencies Fall in Q2 2026 as Available Credit Hits Record $4.3 Trillion
Key Takeaways
- •The 30-plus-day delinquency rate on bank-issued credit cards fell to 2.85% in Q2 2026, its lowest level since Q2 2023.
- •The all-card 60-plus-day delinquency rate declined to 2.69%, while the prime-card measure dropped to 0.84%, according to Equifax and Fitch Ratings.
- •The New York Fed said its higher 90-plus-day delinquency reading was driven by stale charged-off debts that remained on credit reports longer.
- •Credit card balances increased to $1.26 trillion, while aggregate credit limits rose to a record $5.56 trillion.
- •Total available credit climbed to a record $4.30 trillion, leaving utilization at about 23% and cardholders far from maxing out their limits.
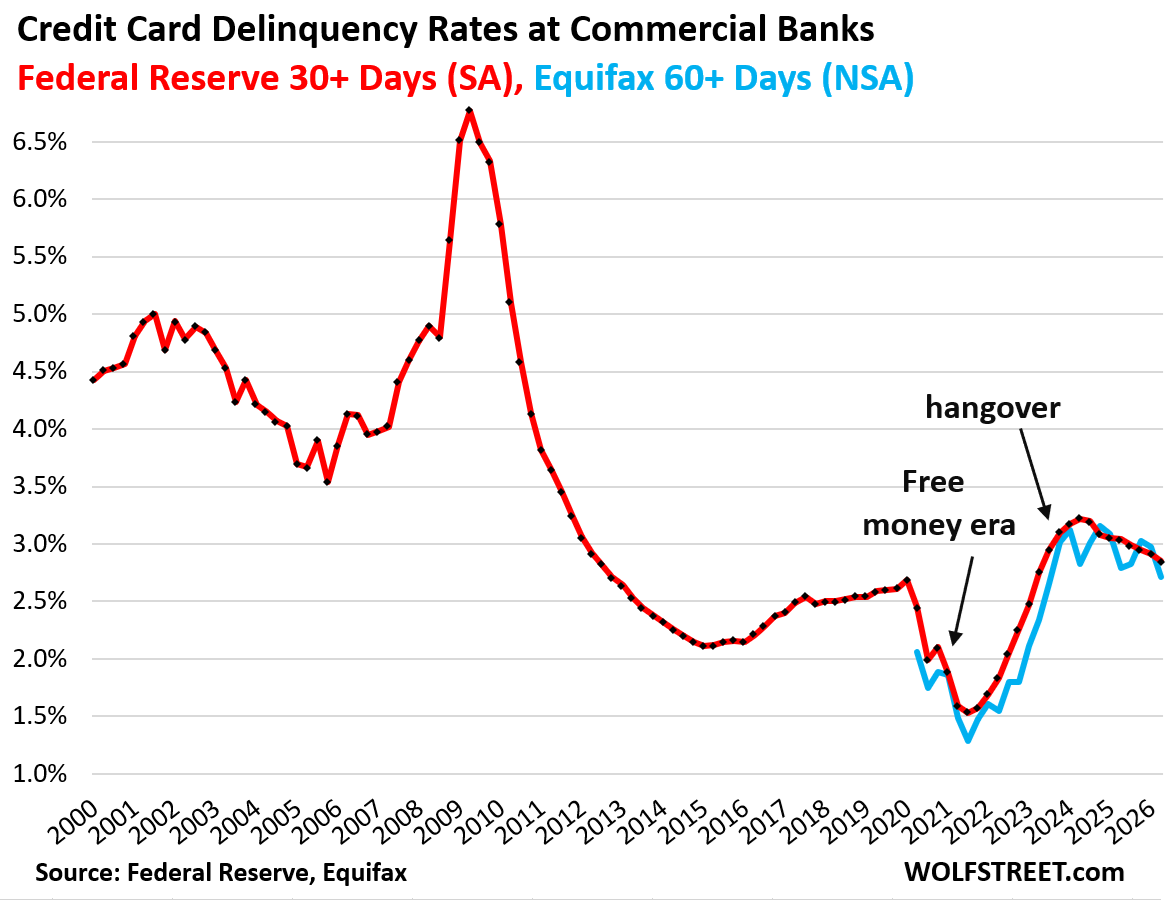
Credit card delinquency rates declined across every major measure in the second quarter of 2026, while aggregate credit limits and total available credit rose to record levels, leaving US cardholders about $4.3 trillion away from maxing out their plastic, according to data from the Federal Reserve, Equifax, Fitch Ratings, and the New York Fed.
Delinquency rates continue to ease
The 30-plus-day delinquency rate on credit cards issued by all commercial banks declined to 2.85% in Q2, seasonally adjusted — the lowest level since Q2 2023 — according to Federal Reserve data released this week and based on regulatory reports filed by all commercial banks. The rate was down from 3.04% a year earlier and 3.22% two years ago.
The 60-plus-day delinquency rate across all credit cards, including private-label cards such as store cards and subprime cards, fell to 2.69% at the end of Q2, down from 2.87% a year ago and 3.04% two years earlier, according to Equifax, whose public data series only extends back to June 2020. That measure is not seasonally adjusted.
Both series reflect the arc of the pandemic-era “Free Money” period, when cash — in the form of federal stimulus checks and expanded unemployment benefits — rained down upon households while restrictions limited credit card spending on travel and other activities, driving delinquency rates to ultra-low levels. When that party came to an end, a hangover followed — but it has been steadily worked off since.
For prime-rated cardholders, the 60-plus-day delinquency rate declined to 0.84%, the lowest since the free-money era and well below any level recorded before it, according to Fitch Ratings, which tracks the performance of asset-backed securities (ABS) backed by prime credit card balances.
The mystery of the 90-day-plus delinquency rate
Considerable attention focused over the past year on the rising 90-plus-day delinquency rate for credit cards published by the New York Fed, which is based on Equifax credit reports. The measure was repeatedly cited as Exhibit A of consumers cracking under financial strain — unsurprising, given that household spending accounts for roughly two-thirds of US economic activity, making card performance a closely watched read on the health of the American consumer.
When the New York Fed released its Q2 Household Debt and Credit Report earlier in August, however, it clarified the issue in a blogpost. The elevated figures reflected “stale, charged-off debts” that banks had not yet removed from customers' credit reporting, potentially because they were still trying to collect on those charged-off balances. A charge-off occurs when a lender writes a balance off its books as uncollectible, typically after around 180 days of missed payments; the underlying debt does not vanish, and lenders can keep pursuing it or sell it to third-party collectors.
The New York Fed noted that this was a new trend: in pre-pandemic years, banks removed stale charged-off debts from credit reporting sooner, and those old charged-off balances would then disappear from the Equifax 90-plus-day delinquency rate.
“We find that the stock delinquency rate is rising because of a pool of stale, charged-off debts that lenders have been reporting for longer durations, rather than a fundamental worsening in the incidence of delinquency,” the New York Fed wrote in the blogpost.
Balances measure spending, not borrowing
Credit card balances are statement balances recorded before payments are made. They are a measure of spending, not a measure of borrowing. Most of those charges are paid off by the due date each month and never accrue interest.
Credit cards are the dominant consumer payment method for smaller purchases — restaurants, travel reservations, online purchases, point-of-sale transactions at stores and stalls, and wireless bills and streaming subscriptions charged automatically to the card. Credit card payment volume runs well ahead of debit card payment volume. Payments where credit cards are generally not accepted, such as rents and mortgage payments, and very large payments, such as house down payments, tax payments, and vehicle purchases, tend to be made by check or ACH bank transfer. Cash is still used by some holdouts, but mostly for small purchases.
In 2024, consumers in the US paid for $6.51 trillion in goods and services with their credit cards, up 11.7% from two years earlier, according to the Federal Reserve's payments study released in July. The study does not provide data for 2025.
The Nilson Report estimated that credit card payments grew by 6.1% in 2025. Credit card platforms such as Visa, Mastercard, and American Express have reported strong annual growth rates in credit card payments. Visa, in its most recent quarterly financials, said payments volume by US cardholders rose 9% year-over-year through Q1 2026, after somewhat slower growth of 6.8% last year. On that basis, credit card payments can be estimated to have grown by about 6.1% in 2025, which would amount to roughly $6.9 trillion flowing through US consumers' credit cards in a single year.
Balances barely move as trillions flow through
Credit card statement balances rose by $54 billion (+4.5%) year-over-year to $1.26 trillion, according to the New York Fed's Household Debt and Credit report, which is based on Equifax data. The majority of those balances are paid off by the due date and never accrue interest, because cardholders use credit cards as a payment method rather than a borrowing method. While nearly $7 trillion flowed through credit cards over 12 months, statement balances rose by only $54 billion over the same period.
“Other” consumer loans — a category comprising personal loans, Buy-Now-Pay-Later (BNPL) loans, payday loans, and similar products — rose by $28 billion, or 5.2%, year-over-year to $568 billion. These balances accrue interest, except for current BNPL balances. The category has barely risen over the past 23 years despite population growth, income growth, spending growth, inflation, and the arrival of BNPL lending.
The burden of credit card debt
Credit card balances and “other” consumer debt combined rose to $1.83 trillion.
The debt-to-income ratio is a classic way of evaluating the burden of a debt. Household disposable income, as published by the Bureau of Economic Analysis, consists of after-tax wages plus income from interest, dividends, rentals, farm income, small business income, and government transfer payments, among other sources. It excludes capital gains — which is where the wealthy make most of their money — and thereby excludes income from stock-based compensation plans and capital appreciation, the source of billionaires' fortunes.
The debt-to-disposable-income ratio for credit cards and “other loans” combined was 7.75% in Q2, up marginally from 7.68% a year earlier. It remains historically low, apart from the free-money era, when transfer payments distorted household disposable income out of all proportion.
How much room is left on those credit cards?
The aggregate credit limit rose by $324 billion year-over-year to a record $5.56 trillion. With credit card balances at $1.26 trillion, total available credit rose by $270 billion year-over-year to a record $4.30 trillion — putting aggregate card utilization, balances as a share of limits, at roughly 23%.
Banks make money on the swipe fees they earn every time a customer uses a credit card to pay; the merchant pays those fees. Those fees — known as interchange — remain uncapped for credit cards, unlike debit card interchange, which Congress capped for large banks under the Durbin Amendment in 2010, a long-running point of contention between banks and merchants. Many cards also carry annual fees. These fees are a major profit center, which is why banks and their affiliate partners — airlines among them — aggressively market their cards to attract new accounts, offering cardholders inducements such as 1% or 2% cash-back, miles, or similar rewards.
The gap between balances and limits means credit cards remain roughly $4.3 trillion away from being “tapped out.” Relative to soaring credit limits, households have taken on comparatively little credit card debt.
The report concludes a four-part quarterly analysis of household debt. The other three parts cover The State of Americans' Auto Debt, Household Debts, Debt-to-Income Ratio, Delinquencies, Foreclosures, Collections & Bankruptcies in Q2 2026, and Here Come the HELOCs: Mortgages, Housing-Debt-to-Income-Ratio, Serious Delinquencies, and Foreclosures in Q2 2026.
Source: Wolf Street
