Business Cycle Indicators: Real Consumption Is Flat
Key Takeaways
- •Nominal consumption increased 0.2% in July, topping the 0.1% Bloomberg consensus estimate.
- •Real personal income excluding transfers remained below its recent peak despite the rise in income.
- •Durable consumption declined, while real retail sales excluding gasoline stations were relatively flat.
- •Household employment measures continued to trend downward even though population controls were unchanged.
- •The data point to uneven business-cycle signals, with spending holding up better than household labor-market indicators.
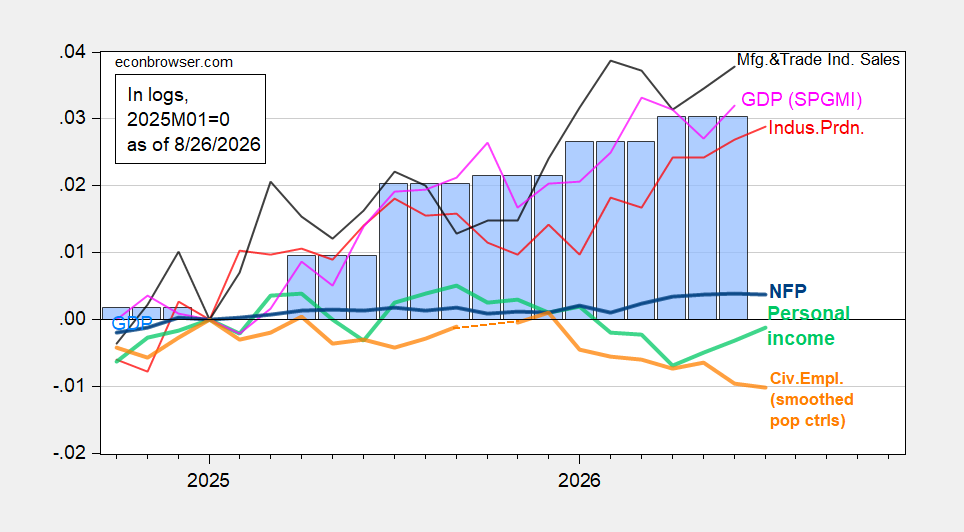
Nominal consumption beat expectations, rising 0.2% month over month versus a 0.1% Bloomberg consensus estimate, but real personal income excluding transfers remains below its recent peak. That combination matters because consumption is a key monthly read on household demand, while income and employment are the income-side inputs that typically help sustain it over time.
Figure 1: NFP employment (bold blue), civilian employment with smoothed population controls (bold orange), industrial production (red), personal income excluding current transfers in Ch.2017$ (bold light green), manufacturing and trade sales in Ch.2017$ (black), and monthly GDP in Ch.2017$ (pink), GDP (blue bars), GDPNow nowcast of 7/10 (light blue box), all log normalized to 2025M01=0. Source: BLS via FRED, BLS, Federal Reserve, BEA 2026Q2 2nd release, S&P Global Market Insights (nee Macroeconomic Advisers, IHS Markit) (8/3/2026 release), and author’s calculations.
Figure 2: Civilian employment adjusted to NFP concept smoothed population controls, using experimental controls for 2025 (bold orange), manufacturing production (red), ADP private nonfarm payroll employment (light green), real retail sales, CPI deflated (black), freight services indexes (brown), and coincident index in Ch.2017$ (pink), GDO (blue bars), all log normalized to 2025M01=0. Source: BLS, ADP via FRED, Philadelphia Fed, Bureau of Transportation Statistics, Federal Reserve via FRED, BEA 2026Q2 2nd release, and author’s calculations.
The fact that consumption was flat in July is notable given rising personal income excluding transfers. The S&P 500 was also flat, perhaps not coincidentally. Below is a detailed comparison of consumption, durable consumption, and real retail sales excluding gasoline stations.
Figure 3: Consumption (bold black), durable consumption (blue), retail sales ex gasoline stations deflated using core CPI (red), all in real terms, in logs 2025M01=0. Source: BEA, Census, BLS and author’s calculations.
The drop in durables consumption might reflect forward-looking behavior tied to household wealth, rather than any specific tariff-related issue, but that is unclear.
The most interesting feature of the charts is the continued downward trend in household measures of employment, at a time when the population controls are unchanged. Taken together with the relatively flat consumption and retail series, the charts suggest that recent business-cycle signals are not moving uniformly: some spending measures are holding up, while household labor-market indicators remain weaker than the broader output-side indicators shown above.
