Economic Sentiment Indicators Stabilize Near Pre-War Levels but Remain Below Pre-Trump Baseline
Key Takeaways
- •The University of Michigan and Conference Board indices have stabilized near pre-U.S.–Iran war levels but remain 2.2 to 2.4 standard deviations below their pre-tariff baselines.
- •Gallup's economic confidence measure shows a comparatively smaller decline, sitting 1.1 standard deviations below its pre-tariff level.
- •The April 2025 'Liberation Day' tariff announcement and the onset of the U.S.–Iran war both corresponded to notable shifts in sentiment trajectories across all three indicators.
- •The recent partial rebound in the Michigan sentiment index appears to correlate with declining U.S. retail gasoline prices, according to EIA data.
- •Differences in how each index responded to recent shocks reflect survey design variations, with the Conference Board emphasizing labor market assessments and the Michigan survey capturing inflation expectations monitored by the Federal Reserve.
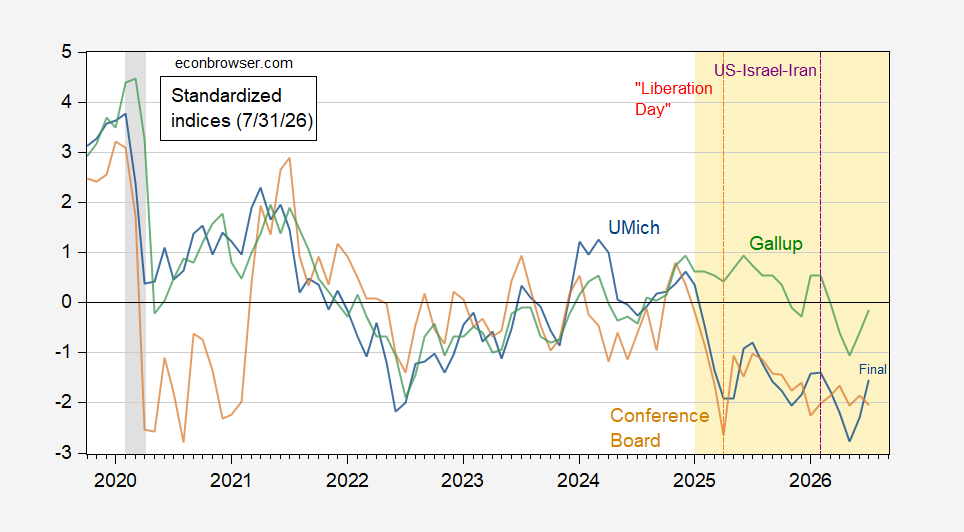
Recent readings of major U.S. consumer sentiment and confidence indicators show signs of stabilization, with the University of Michigan's final sentiment index and the Conference Board's Consumer Confidence Index both approaching levels recorded before the onset of the U.S.–Iran war. However, both measures remain significantly depressed relative to the period before the Trump administration's tariff policies took effect.
Specifically, the University of Michigan and Conference Board indices currently sit approximately 2.2 to 2.4 standard deviations below their pre-tariff levels, based on a normalization covering the period from January 2021 through February 2025 (each series demeaned and divided by its standard deviation over that window). Gallup's economic confidence measure shows a comparatively smaller decline, sitting 1.1 standard deviations below its pre-tariff baseline.
The analysis references two key inflection points marked on the standardized chart: an orange dashed line denoting "Liberation Day" — the April 2025 announcement of sweeping reciprocal tariffs — and a purple dashed line marking the start of the U.S.–Iran war. Both events correspond to notable shifts in sentiment trajectories across all three indicators. The divergence in how each index responded to these shocks reflects differences in survey design: the Conference Board's index places greater weight on respondents' assessments of the labor market, while the Michigan survey captures both current conditions and forward-looking expectations, including a closely watched series on one- and five-year inflation expectations that the Federal Reserve monitors as an input to its policy deliberations.
Sources for the standardized comparison include the University of Michigan Surveys of Consumers, the Conference Board Consumer Confidence Index, Gallup, and the author's calculations.
The partial rebound observed in the Michigan sentiment series appears — at least visually — to correlate with movements in gasoline prices. A companion chart plotting the University of Michigan Consumer Sentiment index alongside the U.S. retail price of gasoline (on a logarithmic scale) suggests that declining fuel costs may be contributing to the recent improvement in consumer attitudes. Gasoline price data is sourced from the U.S. Energy Information Administration (EIA).
Historically, consumer sentiment indicators have exhibited only a loose relationship with actual household spending growth, meaning that depressed readings do not mechanically translate into proportional reductions in consumption. Nonetheless, sustained declines in confidence — particularly when broad-based across multiple surveys — have been associated with weaker consumer expenditure in prior economic cycles.
The University of Michigan Surveys of Consumers and the Conference Board Consumer Confidence Index are two of the most widely tracked gauges of U.S. consumer attitudes. The Michigan survey, conducted monthly, assesses households' assessments of current economic conditions and their expectations for the coming year. The Conference Board's index, also released monthly, is derived from a mail-based survey of households and is closely watched by economists and policymakers for signals about future consumer spending, which accounts for a substantial share of U.S. gross domestic product. Gallup's economic confidence measure, based on telephone interviews, aggregates Americans' ratings of current economic conditions and their perceptions of whether the economy is improving or worsening.

