US Consumer Sentiment Declines Across Standardized Measures
Key Takeaways
- •Consumer sentiment declined across all three standardized measures compared in the August 14, 2026 Econbrowser update.
- •The analysis compares the University of Michigan survey (with the Cummings Tedeschi adjustment for partisan nonresponse bias), the Conference Board Confidence Index, and Gallup confidence on a common scale based on the January 2021 to February 2025 period.
- •The chart's red dashed line marks April 2, 2025, known as "Liberation Day," when the Trump administration announced sweeping tariffs.
- •The synchronized decline across independent survey organizations points to a broad shift in household attitudes rather than a quirk of any single poll.
- •Because consumer spending accounts for roughly two-thirds of U.S. economic output, forthcoming monthly releases from the three surveys will show whether the downturn continues.
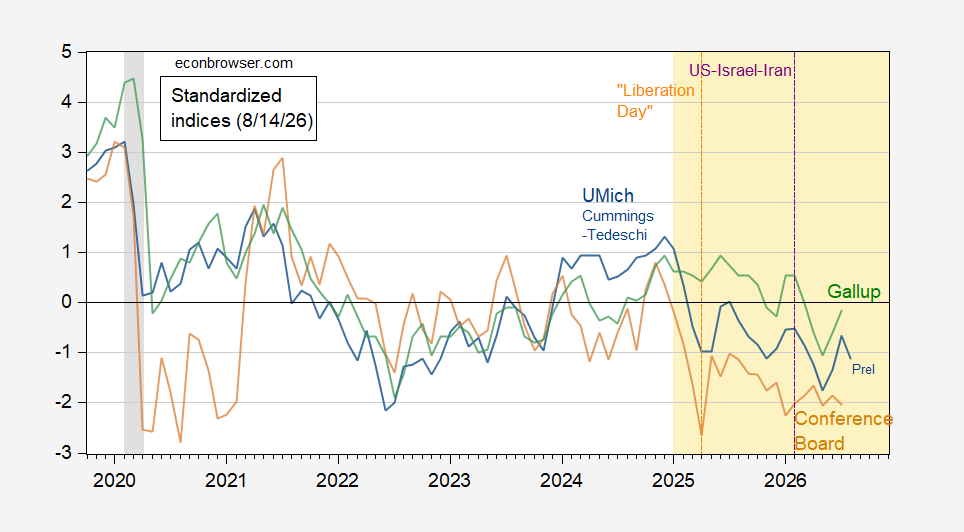
The latest Econbrowser update on consumer sentiment shows sentiment declining across the major standardized measures of U.S. consumer attitudes.
The August 14, 2026 post compares three indicators on a common, standardized scale:
- U. Michigan Economic Sentiment, using the Cummings Tedeschi adjustment (blue)
- Conference Board Confidence Index (brown)
- Gallup Confidence (green)
Each series is demeaned and divided by its standard deviation over the period 2021M01-2025M02, allowing the movements of the three surveys to be compared directly on the same footing. Because the three polls differ in question wording, fielding approach, and sample design, putting them on a common scale helps separate broad shifts in household attitudes from quirks of any single survey. A red dashed line in the chart marks "Liberation Day" — April 2, 2025, the date the Trump administration announced sweeping tariffs. Sources for the figure: UMichigan, Gallup, Conference Board, and author's calculations.
Each of the three series is a widely followed gauge of U.S. consumer attitudes. The University of Michigan's Surveys of Consumers, conducted since 1946, tracks households' assessments of the economy, their personal finances, and buying conditions. The Conference Board's Consumer Confidence Index, published monthly since 1967, measures consumers' appraisals of current conditions and their expectations for the months ahead. Gallup regularly surveys Americans' views of the economy through its ongoing polling. The Cummings Tedeschi adjustment applied to the Michigan series is a proposed correction for partisan nonresponse bias in the survey.
Measures like these draw close attention because household attitudes feed into expectations about consumer spending, which accounts for roughly two-thirds of U.S. economic output. A decline that shows up across all three standardized series reflects readings from independent survey organizations moving in the same direction, rather than a shift confined to one poll. Whether the dip continues will be visible in the upcoming monthly rounds of the Michigan survey, the Conference Board index, and Gallup's ongoing polling.
The original post is available at Econbrowser.

