Uniswap Price Prediction 2026-2032: Will UNI Keep Steady?
Key Takeaways
- •UNI was trading near $3.80 on July 28, 2026, after a partial rebound but remained 2.41% lower over the prior 24 hours.
- •Daily chart analysis placed resistance near $3.88 and support around $3.41, while the four-hour chart showed support near $3.57 and resistance near $3.97.
- •The report forecasts a maximum Uniswap price of $3.65 in 2026 and an average of $2.56 for that year.
- •Long-term projections in the report place UNI at an average of $5.46 in 2028 and $11.64 in 2032, with a 2032 maximum of $12.5.
- •The article says Uniswap v2, v3, v4 and UniswapX are live on Robinhood Chain, a Layer 2 built by Robinhood Crypto.
Uniswap (UNI) could reach as high as $3.65 in 2026, according to the forecast in this report. Estimates for Uniswap’s average price in 2028 range from $5.10 to $5.87, while the projected average price for 2032 is $11.64, with a maximum of $12.5.
Uniswap is a DeFi protocol founded in 2018 by former mechanical engineer Hayden Adams. The Uniswap exchange is a 100% on-chain automated market maker (AMM) protocol on the Ethereum blockchain. The AMM allows DeFi users to swap ether (ETH) for any ERC-20 token without intermediaries, helping solve liquidity problems common across many exchanges. Uniswap’s utility has made its governance token, UNI, a point of interest for traders and investors.
Will UNI reach $100? How high can UNI go in five years? This report reviews Uniswap’s technical analysis and price prediction to address those questions.
Overview
Uniswap price prediction: Technical analysis
Uniswap price analysis
TL;DR Breakdown:
- Uniswap price analysis shows a mixed trend near $3.80.
- The altcoin market is recovering today, but UNI is down 2.41% over the past 24 hours.
- UNI has support around the $3.41 level.
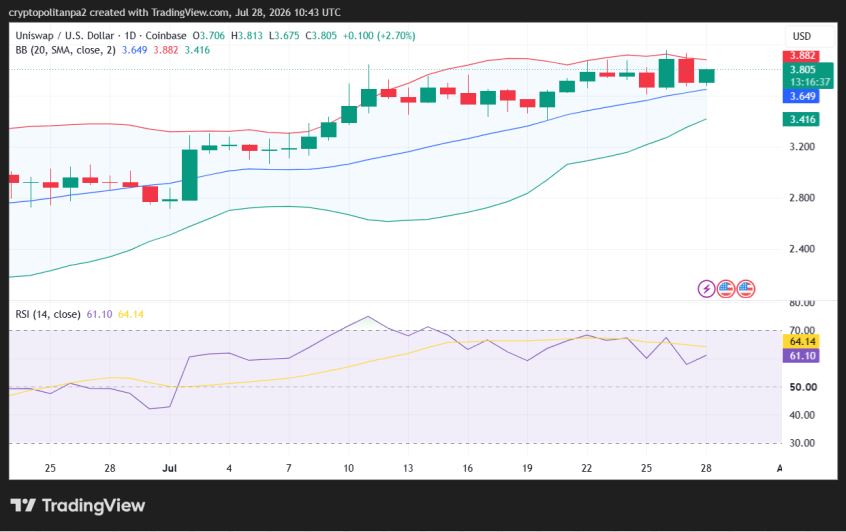
On July 28, 2026, Uniswap (UNI) price analysis showed a mixed intraday outlook. The altcoin had partially recovered to $3.80, though it remained down 2.41% over the previous 24 hours. From a broader perspective, UNI continued to face strong resistance near local highs. A brief spike to $3.88 on July 26 was reversed the next day, sending the token back toward current levels in line with its wider bearish structure.
Uniswap price analysis on the daily time frame
The one-day price chart for Uniswap shows a partial recovery in the market. The UNI/USD pair is hovering near $3.80 as selling pressure continues. However, the bullish push has slightly lifted the price, with a green candlestick on the chart reflecting intraday buying momentum.
The distance between the Bollinger Bands highlights the intensity of volatility. This spread is wide, indicating high volatility. In addition, the upper Bollinger Band, which marks resistance, has shifted to $3.88, while the lower band, which marks support, has moved to $3.41.
Although many traders view it as a basic momentum gauge, the RSI can also help identify bullish or bearish divergences that often precede a trend reversal. The Relative Strength Index (RSI) is trending in the neutral region. The indicator was recorded at 61 today. The slightly upward curve on the RSI suggests bullish presence, and more stability may follow if buying momentum strengthens and the score rises further.
Uniswap price analysis on the 4-hour chart
The four-hour technical analysis of Uniswap shows the price recovering after a correction and holding above support at $3.77. This is reflected in the token trading near $3.80 over the past four hours. UNI may rise further in the coming hours if buying continues, as the likelihood of another move higher remains elevated.
High volatility on the 4-hour chart points to a greater chance of either a reversal or additional price appreciation. The Bollinger Bands are covering more area, which indicates increased volatility and lower market predictability. The upper Bollinger Band has shifted to $3.97, marking resistance, while the lower Bollinger Band has moved to $3.57, establishing support.
The Relative Strength Index (RSI) has risen to 52 over the past few hours, and its curve is pointing upward as it remains near the center of the neutral region. This suggests a balanced trading setup on the four-hour chart. Further gains are possible only if buyers continue to push through resistance zones in the next few hours.
Uniswap technical indicators: Levels and action
Daily simple moving average
Daily exponential moving average
What to expect from Uniswap price analysis next?
Uniswap price analysis suggests a mixed outlook for the current market trend. The coin is recovering in the current session, but it still shows a 2.41% loss over the past 24 hours after a bearish slide. If buyers maintain momentum, UNI’s price could move toward the $3.7 range. That said, the recent rebound still sits below the levels seen earlier in 2026, so traders are watching whether the token can hold above nearby support rather than giving back the day’s gains.
Is Uniswap a good investment?
Uniswap is a decentralized cryptocurrency exchange (DEX) with significant potential. Unlike traditional exchanges, Uniswap uses an automated market-making (AMM) system. The project has shown solid performance over time and is expected to reach $4.77 by 2027 and above $12.5 by 2032. Its relevance also extends beyond price performance, since Uniswap remains one of the most recognized names in decentralized trading and the token’s outlook is tied to continued use of the protocol across Ethereum-based DeFi activity.
Why is UNI down?
The broader crypto market is experiencing negative sentiment today. Most leading cryptocurrencies are losing value, and UNI is also down 2.41% over the last 24 hours, despite a partial recovery.
How much will Uniswap be worth in 2026?
The maximum UNI can reach in 2026 is $3.65, while the average price is expected to be around $2.56.
Will UNI reach $10?
Uniswap is trading just above the $3 range, down from $18.59, which it reached in December last year. The current resistance levels are $3.31 and $3.82; a break above them could lead to $11. If UNI receives more support, $10 could be reached by 2031.
Will UNI reach $50?
In May 2021, UNI touched $44.9, its all-time high, which is not far below $50. That possibility could return if the broader cryptocurrency market turns bullish on political and economic factors. However, this is not investment advice, and readers should seek independent professional consultation before making any investment decision.
Can Uniswap reach $100 dollars?
According to the Uniswap price prediction, UNI is not expected to come near $100 after 2032. Although this is a five-year time frame, it may still be worth waiting, as the coin’s value is projected to increase even if it does not reach $100.
Does UNI have a good long-term future?
UNI is the token of the well-known Uniswap decentralized exchange. It has a broad user base and strong liquidity, which gives the coin good long-term prospects. Market analysts expect UNI’s price to reach $12.5 by the end of 2032, well above its current level.
Recent news/opinions on Uniswap Network
Uniswap v2, v3, v4, and UniswapX are live on Robinhood Chain, a Layer 2 built by Robinhood Crypto.
Robinhood Chain is here Integrate the chain built for real-world assets with Uniswap API Live from day one 🦄 — Uniswap Developers (@UniswapBuilders) July 1, 2026
Robinhood Chain is here Integrate the chain built for real-world assets with Uniswap API Live from day one 🦄
Uniswap price prediction July 2026
For July 2026, UNI is showing the potential for wide swings. The anticipated minimum value of Uniswap is $2.25. The price may rise to $3.61, while the average trading price is expected to be $3.03 for the month.
Uniswap price prediction 2026
For 2026, UNI’s price could reach a maximum of $3.65. The minimum price is expected to be $1.91, and the year’s average trading price is estimated at around $2.56.
Uniswap price predictions for 2027-2032
UNI price prediction 2027
For 2027, Uniswap’s price is projected to have a minimum value of $3.87. The price could rise to $4.77, with an average of $4.12.
Uniswap (UNI) price prediction 2028
In 2028, UNI is anticipated to reach a minimum price of $5.10. The maximum price may hit $5.87, with an average trading value of $5.46.
Uniswap price prediction 2029
The 2029 forecast for Uniswap predicts a minimum price of $6.34 and a maximum of $7.38, with an average price of $6.89, many times higher than the current Uniswap price.
Uniswap price forecast 2030
The Uniswap price forecast for 2030 shows the coin starting at a minimum UNI price of $7.96 and climbing to $9.30, while averaging $8.61.
Uniswap (UNI) price prediction 2031
For the 2031 Uniswap coin price prediction, the minimum projected price for Uniswap is $9.55. Traders can expect a maximum price of $10.70 and an average price of $9.85, based on future price movements.
Uniswap price prediction 2032
For the 2032 Uniswap forecast, UNI is projected to have a minimum price of $11.14. The price could rise to $12.5, with an average of $11.64.
UNI market price prediction: Analysts’ UNI price forecast
Cryptopolitan’s Uniswap price prediction
Our price prediction for Uniswap shows that UNI will reach a high of $3.65 near the end of 2026. In 2027, it is expected to trade between $3.87 and $4.77. In 2032, UNI is forecast to range between $11.14 and $12.5, with an average price of $11.64. These predictions are not investment advice. Professional consultation is suggested, or readers can carry out their own research.
Uniswap historic price sentiment
Uniswap (UNI) launched on September 17, 2020, at $3.00. It quickly rose to $7.00 before reaching an all-time low of $1.03 (CoinGecko) or $0.4190 (CoinMarketCap) on the same day. UNI ended 2020 at $5.00 after a gradual recovery during the 2020 bull run.
In 2021, UNI surged 400% in January to $20. By March, it had reached $28, and on May 3 it hit an all-time high (ATH) of $44.93, lifting its market capitalization sharply. It ended the year near $18 after a significant decline.
Throughout 2022, UNI continued to fall as cryptocurrency prices weakened, dropping to around $5.5 by June as the bearish trend persisted.
The crypto market rebounded in 2023, and UNI gained momentum, peaking at $7.77 on December 28.
UNI began 2024 in a downtrend, briefly recovering to $15 by March 6. After mid-May, it came under selling pressure and fell to $0.14 by July 31 as UNI holders continued to sell assets.
It stabilized in August at around $5 and traded above $6 at the start of September. In October, UNI reached $8, and November saw a peak of $13.58. In December, UNI climbed to $18.60.
In February 2025, Uniswap was trading near $12, below January’s level of $15. In March, it fell further into the $7.4 range, and the decline continued into April with a price of $4.7. Some bullish price action appeared in May, when UNI rose to $7.5 and later peaked at $11.74 in July.
August was also bullish, as UNI/USD reached a yearly high of $12.31, though the token remained in a downtrend in September and October.
UNI traded near $5.7 in early November. After surging toward $10 in mid-November, the price declined again toward $5.5 in early December.
At the start of January 2026, UNI was trending near $5.8, but by March its price had fallen to $3.79. In April, UNI traded just above $3 and held that level through the end of May, before dropping to $2.3 at the start of June.
In July, UNI is trending near $3.1, with current market sentiment still bearish.