Uniswap (UNI) Price Faces $8.87 Risk as Exchange Supply Hits 60-Day High
Key Takeaways
- •UNI rallied roughly 30% between September 17 and September 22, then closed about 10% lower on September 23 after touching an intraweek high near $10.95.
- •Exchange inflows of 6.3 million UNI—about $58 million—between September 17 and September 23 pushed exchange-held supply to within 0.2% of its 60-day high, though deposits alone do not confirm selling intent.
- •A weekly RSI near 73 signals overbought conditions, and the rejection below $11.50 aligns with the 0.6 Fibonacci retracement level near $11.51.
- •A liquidation heatmap places about $5.16 million in long-liquidation leverage near $8.87, with total cumulative long exposure reaching roughly $10.35 million if price enters that zone.
- •If $8.87 fails, the 200-week exponential moving average near $7.83 is the next support, while reclaiming the prior weekly high would open a challenge of the $11.50 Fibonacci resistance.
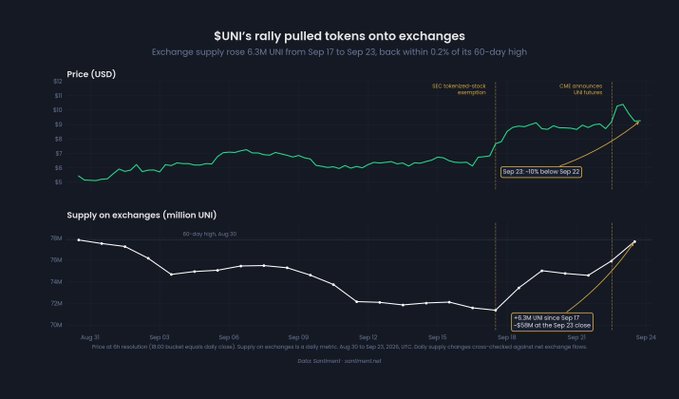
Uniswap (UNI) traded near $9.29 on September 24 after reversing from its weekly high, leaving the token positioned between overhead resistance and a band of leveraged-long liquidation levels below the market. The daily decline accompanied a climb in exchange holdings that pushed available supply to within 0.2% of its 60-day high.
The Uniswap governance token rallied about 30% between September 17 and September 22, then closed roughly 10% lower on September 23 as exchange balances rose throughout the advance. The price move coincided with the SEC's tokenized-stock exemption and a related futures-market announcement — CME Group's plan to launch Uniswap futures on October 19 — though neither event confirms spot accumulation.
Exchange Supply Climbs to Near 60-Day High
Exchange flow data show 6.3 million UNI moved onto centralized platforms between September 17 and September 23, increasing the number of tokens positioned for potential selling or hedging. At the September 23 close, the added balance was worth about $58 million, and the largest inflow sessions occurred on September 22 and September 23. Supply held on exchanges now sits within 0.2% of its 60-day high, putting platform near their highest level in roughly two months.
That metric measures tokens available on trading platforms, not confirmed sales. A deposit can precede a spot sale, a derivatives hedge, collateral posting, market-making activity, or wallet consolidation.
UNI's price and exchange supply moved in opposite directions after the rally, with the September 23 decline following the two largest inflow days. That sequence does not identify individual depositors or their intent, but it does show that larger balances reached venues where token holders can transact.
Rally Stalls Below $11.50 After Rejection
The token reached an intraweek high near $10.95 before slipping toward $9.21 in the most recent session. The pullback left an upper wick on the weekly candle, marking rejected prices below $11.50, a zone that aligns with the 0.6 Fibonacci retracement near $11.51 — a level derived by measuring the depth of the prior advance.
Momentum indicators flash a similar signal. A weekly RSI near 73 places UNI above the commonly watched overbought threshold. An overbought reading does not mandate a reversal, but it indicates that current gains follow an extended advance rather than a fresh base.
Regulatory and derivatives news attracted attention during the rally. The SEC's September 17 order permits temporary, conditional relief for specified tokenized stock venues and liquidity providers. That measure relates to tokenized NMS stocks, not demand for the Uniswap governance token.
Liquidation Clusters Concentrate Near $8.87
Derivatives positioning now focuses attention on $8.87. A one-month Binance UNI/USDT liquidation heatmap places about $5.16 million in long-liquidation leverage around that level, and total cumulative long-liquidation exposure reaches roughly $10.35 million if the price moves into the area. Liquidation heatmaps estimate where clustered leverage would be forced to unwind.
Liquidations can force leveraged positions to close, a process that may generate additional market sells and increase intraday volatility. Short-liquidation liquidity also sits above the market, meaning a recovery could force short positions to buy back tokens and support a temporary squeeze. The larger nearby long exposure, however, lies below the spot price, making $8.87 a key reference level for traders tracking downside momentum over the next few trading sessions.
Deeper Supports and the Path Back to Resistance
The 200-week exponential moving average sits near $7.83 and becomes the next support level if $8.87 fails. A move from $9.29 to $7.83 would represent a decline of roughly 16%. The 100-week exponential moving average waits near $6.91 below that zone — long-horizon averages traders typically use to frame multi-year trend structure.
On the upside, buyers would need to reclaim the prior weekly high to challenge the Fibonacci level near $11.50, and a close above that area would weaken the immediate rejection pattern. Exchange supply would also need to decline before the data could support a stronger accumulation case. Until then, higher platform balances and long-liquidation clusters keep the downside levels in focus, with the October 19 futures launch and the daily direction of exchange flows the dated markers to watch.

