30-Year Treasury Yield Hits 5.28% as Bond Market Steepens, but Spreads Remain Narrow
Key Takeaways
- •The 30-year Treasury yield reached 5.28%, marking its highest level since July 2006 and sitting 165 basis points above the Effective Federal Funds Rate.
- •Fed Chair Warsh stated that eliminating forward guidance has pushed bond market participants to price in inflation and economic data independently rather than relying on Fed signals.
- •The bond bear market that began in mid-2020 has lasted six years and contributed to the collapse of several regional banks in 2023, including Silicon Valley Bank and Signature Bank.
- •The Treasury yield curve has steepened to a healthier shape after repeated inversions and mid-curve sags that had triggered recession calls over the prior several years.
- •Credit spreads remain historically narrow despite surging Treasury yields, suggesting the sell-off reflects concerns about inflation and supply rather than worsening corporate credit quality.
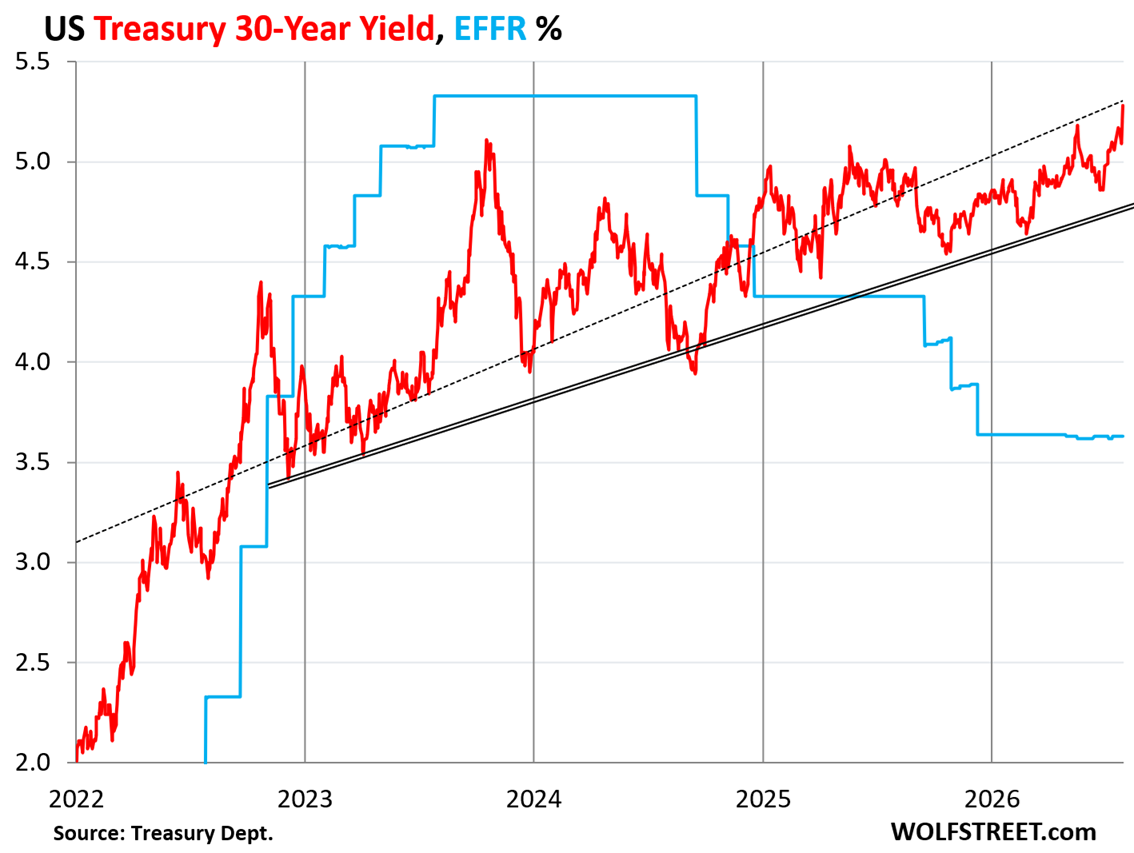
Warsh wants the bond market to do its job and look at inflation and the economy — and not at the Fed — and it's finally doing it.
The 30-year Treasury yield jumped 7 basis points on Friday and 12 basis points for the week, reaching 5.28%, the highest level since July 2006. It is now 165 basis points above the Effective Federal Funds Rate (EFFR, blue in the chart below), which the Fed targets with its policy rates.
At the FOMC press conference on Wednesday, Fed Chair Warsh repeatedly said that ending the Fed's "forward guidance" — the practice of signaling to markets the expected path of future interest-rate decisions — was already working. He said Treasury yields had already surged since the June FOMC meeting, when he scrapped forward guidance, as markets began to focus on inflation and economic data rather than on the Fed.
According to Warsh, buyers and sellers were doing the hard work by raising rates and tightening financial conditions, which he said "has provided us some comfort that we've got the ability and capability to deliver." In other words, the bond market was finally doing its job.
The dotted line in the chart reflects the linear trend in the data, and the double line traces the higher lows since late 2023.
Buyers of long-dated Treasury securities are mainly concerned about two things.
First is inflation, which erodes the purchasing power of principal and requires a higher yield as compensation.
Second is the large amount of supply that will need to find new buyers. Higher yields may be needed to attract those buyers to Treasury auctions. But rising yields also mean lower market prices for bondholders who bought at lower yields, and new buyers want to be compensated for the risk that yields may rise further.
Those risks have been increasing. The Fed has done nothing but cut rates since the fall of 2024, even though inflation has been accelerating for more than a year, and that has spooked the bond market.
A two-decade view shows the last 14 years of the 40-year bond bull market, during which the 30-year Treasury yield fell from more than 15% in September 1981 to about 1% in mid-2020. That marked the start of the bond bear market, which is now wrapping up its sixth year.
The current bond bear market has been severe. It helped trigger the collapse of several regional banks in 2023 — including Silicon Valley Bank, Signature Bank, and First Republic Bank — after they had loaded up on long-term Treasuries and government-guaranteed MBS in 2020 and 2021. Those banks had believed the Fed's forward guidance that interest-rate repression would continue for a long time. But the forward guidance was a lie. The Fed ended QE, raised rates, and started QT — quantitative tightening, the runoff of bonds from the Fed's balance sheet — in 2022, sending long-term yields higher and collapsing the market prices of long-term bonds those banks had bought a couple of years earlier.
The market value of 30-year Treasury bonds sold by the government at auction in mid-2020 has dropped by about 50%.
Investors who bought those bonds at auction can still hold them for another 24 years until maturity and get all their principal back, but they would collect only about 1.3% interest per year over that period. By contrast, current buyers would earn 5.28% a year. By the time the bonds mature, inflation will have eaten away a large part of the principal's purchasing power. Those 2020 bonds were a terrible deal for the original buyers.
Before Warsh became Fed chair, he blasted the Fed's forward guidance. He said that forward guidance had locked in the Fed while inflation was surging in 2021, even though the Fed was still at 0% and still doing massive QE. He called it "the most reckless Fed ever."
By the time the Fed broke away from forward guidance and began tightening, it was too late. Inflation was already out of the bottle and was not going back in, and some of the banks that had believed the Fed's guidance in 2020 and 2021 later collapsed in 2023.
Warsh removed forward guidance as one of his first moves at the FOMC and told the bond market to figure things out on its own. The buyers and sellers in the bond market are now reacting to economic data, inflation, and supply data, rather than to the Fed.
The 10-year Treasury yield rose 7 basis points on Friday to 4.75%. It briefly hit 5% during the debt scare in October 2023, and that level opened the floodgates of demand, which pushed the yield back down sharply.
But there is no guarantee those floodgates of demand will reopen at 5% the next time.
At this level, the 10-year yield is not high by historical standards. The Fed began its interest-rate repression, including QE, in 2008, which pushed the 10-year yield down to very low levels.
Now inflation is out of the bottle and does not want to go back in on its own, and the Fed cannot do QE in this environment.
Warsh also wants to reduce the Fed's balance sheet further as one way to bring down inflation. That would be the opposite of QE and could put upward pressure on long-term yields. He would need a majority on the FOMC to do that, and at Wednesday's meeting he did not have a majority for anything beyond maintaining the status quo.
This chart shows the 40-year bond bull market from September 1981 to mid-2020, followed by the six years so far of the bond bear market.
Short-term Treasury yields of one year and less declined after the FOMC meeting. They had already priced in a rate hike at either the July meeting or the September meeting. The July rate hike did not happen, and markets are still counting on a September rate hike, though with less conviction.
The three-month Treasury yield fell 13 basis points during the week to 3.83%, according to Treasury Department calculations, putting it about 20 basis points above the EFFR (blue line). The September FOMC meeting falls within the three-month window.
The Treasury yield curve has steepened and is beginning to look healthy. The chart below shows Treasury yields across the maturity spectrum from one month to 30 years on three key dates in 2025 and 2026:
Red line: Friday, July 31, 2026.
Gold dotted line: July 28, 2026, the day before the FOMC meeting.
Blue dotted line: September 16, 2025, before the last three rate cuts.
The yield curve inverted in mid-2022 after the Fed began raising policy rates. Short-term Treasury yields moved higher, while long-term yields lagged and remained below short-term yields. That inversion triggered repeated recession calls because prior yield-curve inversions had been followed by recessions.
Later, as long-term yields caught up, the curve developed a large sag in the middle, with yields between one year and seven years lower than both short-term and long-term yields.
When the yield curve temporarily un-inverted in early 2025, it triggered more recession calls on the theory that the un-inversion itself predicts a recession.
Then in the second half of 2025, the curve developed another deep sag in the middle as a new wave of rate-cut expectations pushed down yields one to three years out.
All of that is now behind. The yield curve finally looks healthy, though not especially steep. It could be much steeper.
The spread between the 2-year and 10-year yield is only 45 basis points. During periods of economic growth, that spread has often ranged from 100 to 250 basis points, suggesting that the 10-year Treasury yield is still well below where it may eventually go. When the spread is negative, the yield curve is said to be "inverted."
The spread between the 3-month and 10-year yield is only 92 basis points. That is also low for periods of economic growth and likewise suggests that the 10-year Treasury yield remains below where it may eventually end up.
While Treasury yields have surged, credit spreads — the extra yield that corporate and other non-government borrowers pay above comparable Treasuries — have remained historically narrow. Narrow credit spreads indicate that investors still demand relatively little compensation for taking on credit risk, even as the broader bond market reprices duration and inflation risk. That divergence suggests that the rise in long-term Treasury yields reflects concerns about inflation, fiscal supply, and the end of Fed guidance rather than deteriorating expectations for corporate credit quality.

